11. OCR: Digitized Data
Data Science for Economists
2026-03-01
Today’s plan
- “Non-computable information”
- Lloyd’s shipping list: The Wind of Change: Maritime Technology, Trade, and Economic Development, Pascali (2017)
- Plantation records: The Development Effects of the Extractive Colonial Economy: The Dutch Cultivation System in Java, Dell and Olken (2020)
- Clay tablets: Trade, Merchants, and the Lost Cities of the Bronze Age, Barjamovic et al. (2019)
Non-computable information
Non-computable information
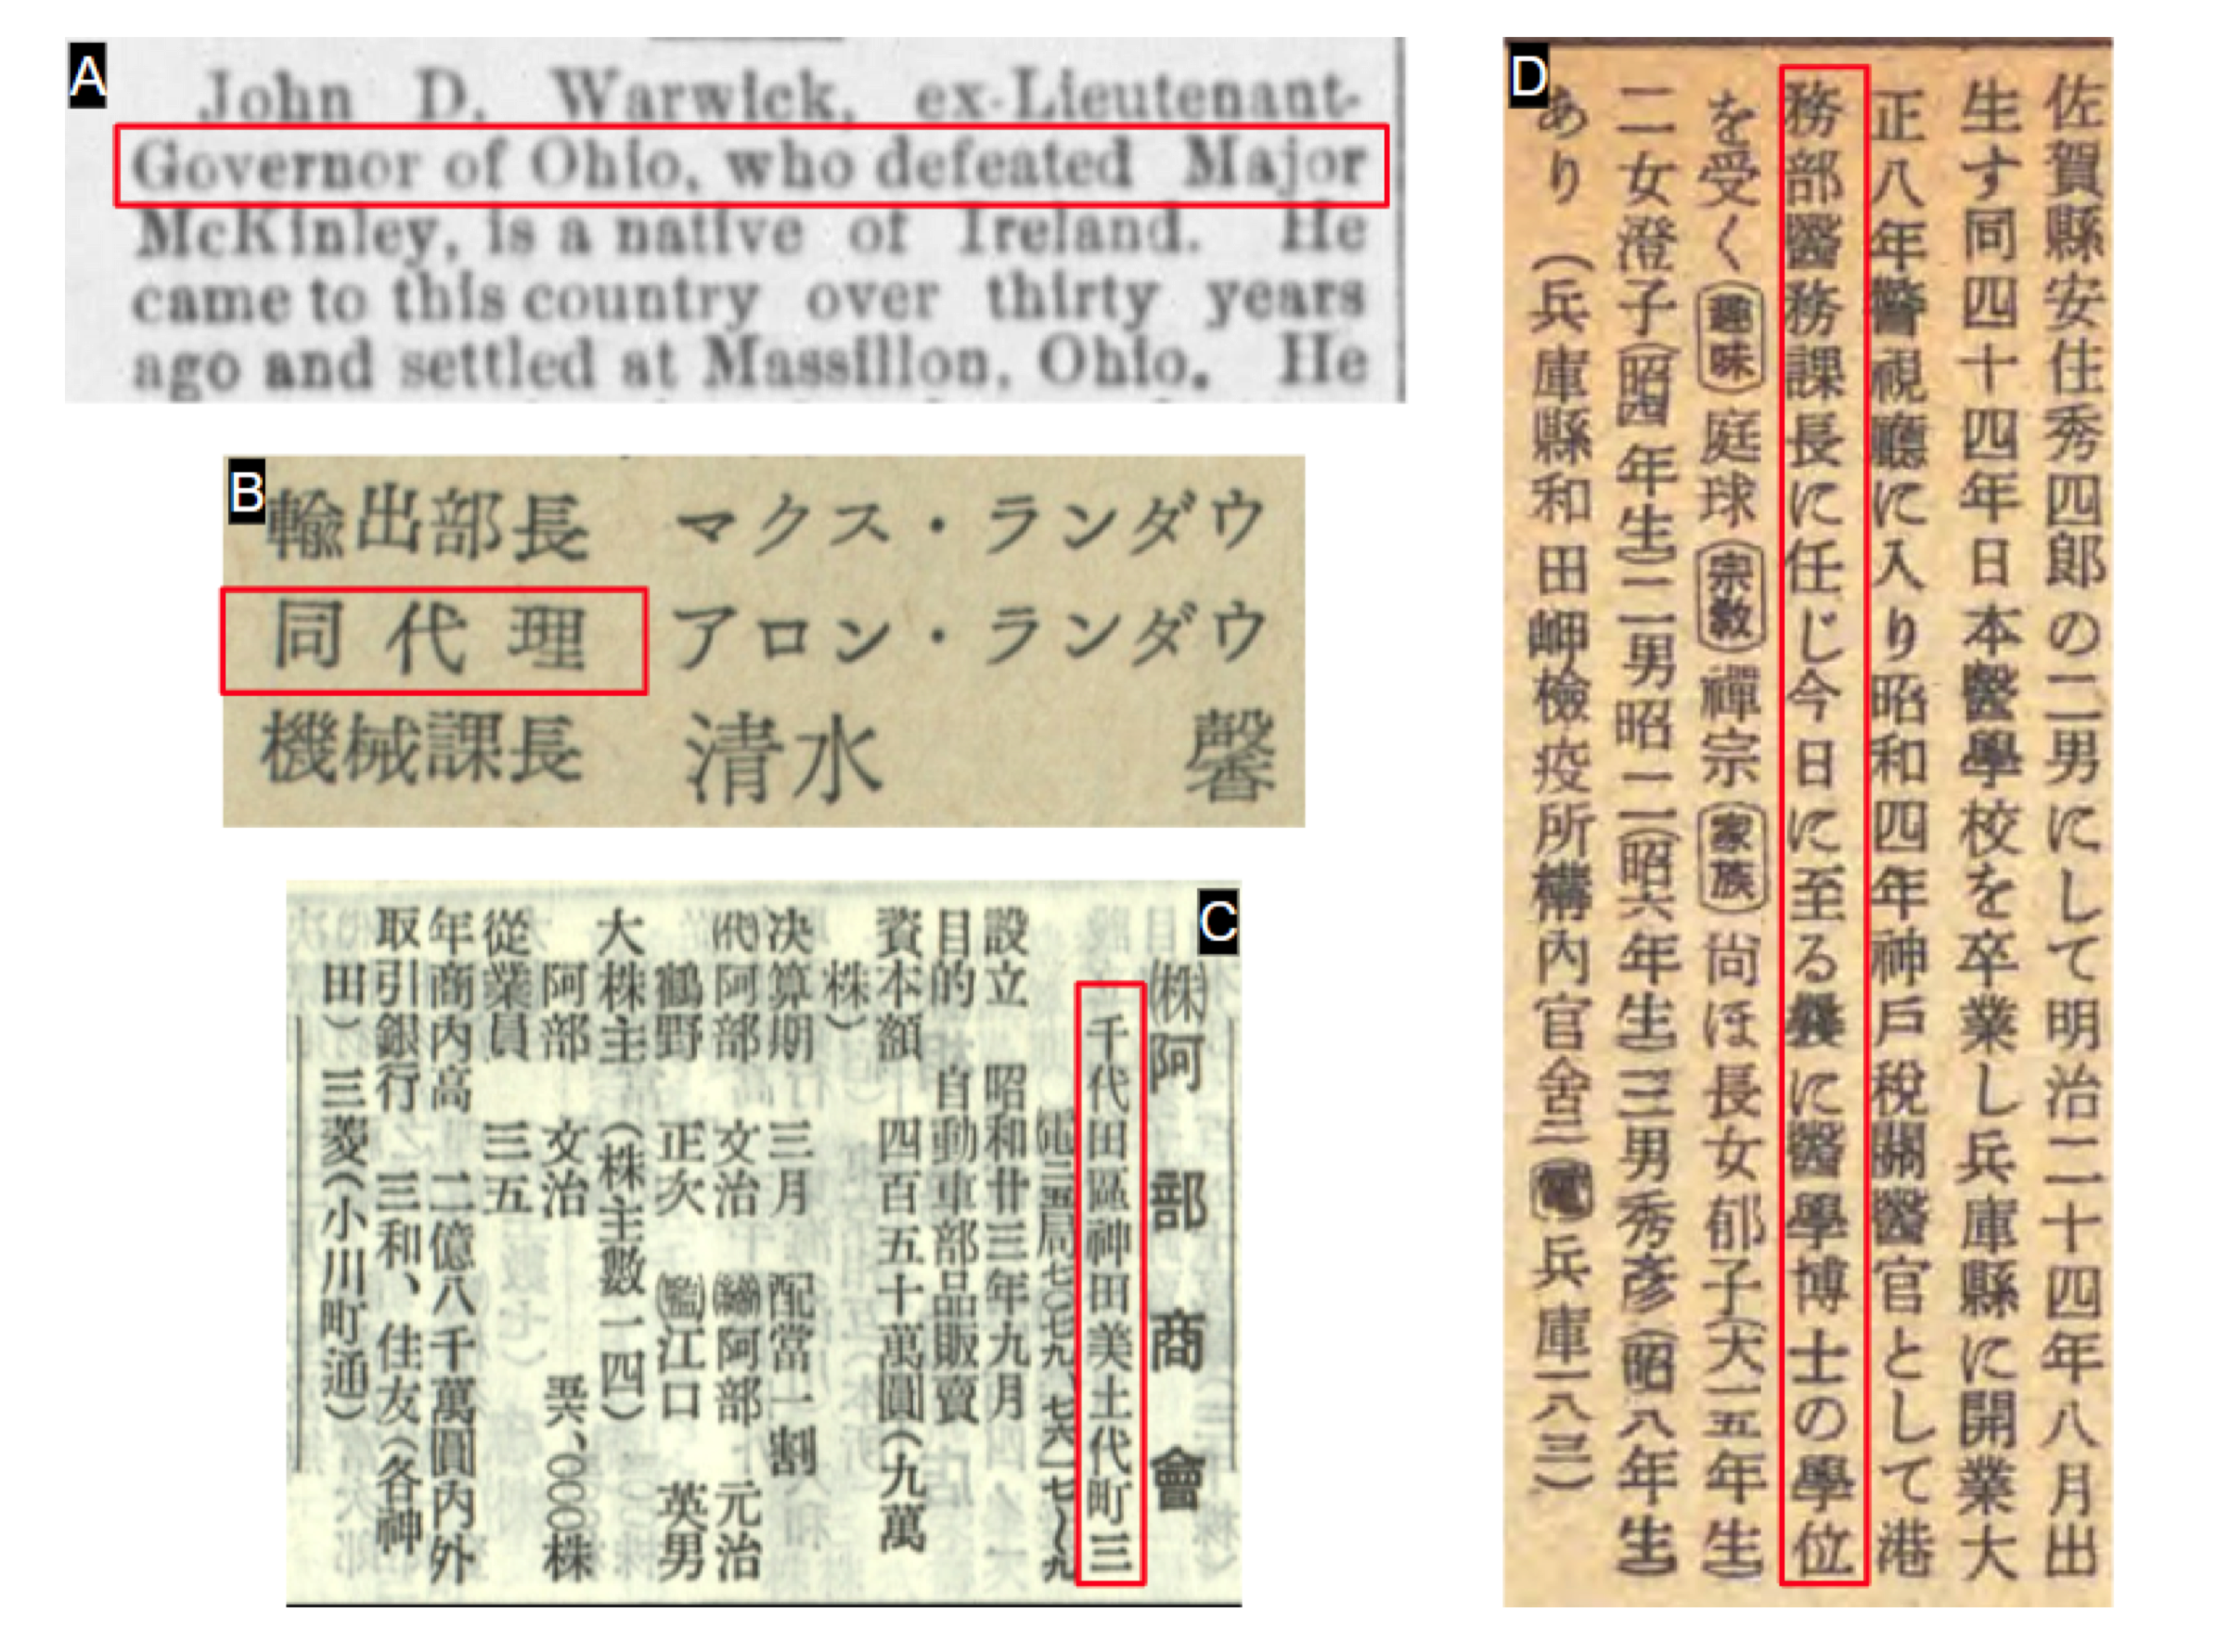
- Standard digitization methods often fail to capture historical documents effectively
- Especially for less frequently used languages, scripts and settings
- Data may also be trapped in various types of images
- Text data contains a significant amount of non-computable information
Economics and data
- Key economic questions necessitate disaggregated data: Misallocation, inequality, social mobility, welfare effects of trade
- Long-term digital disaggregated data uncommon
- Existing data predominantly originating from high resource contexts
- Growing academic interest, also due to much better computing power and methods
Digitizing data
Source: Melissa Dell — “OCR and Record Linkage”, April 2023
OCR
Source: Melissa Dell — “OCR and Record Linkage”, April 2023
OCR
Source: Melissa Dell — “OCR and Record Linkage”, April 2023
Accuracy
- OCR accuracy measured using character error rate (CER)
- Levenshtein distance between recognized string and “ground truth”, normalized by length of “ground truth”
- Minimum number of single-character edits (insertions, deletions or substitutions) required to change one word into the other
- CER of 0.5: mispredicting approximately half of characters
OCR software and tools
- Commercial APIs: Google Cloud Vision, Amazon Textract, Baidu OCR (for Asian languages)
- Open-source engines: Tesseract (bi-directional LSTM), EasyOCR, PaddleOCR
- Transformer-based models: TrOCR (Li et al., 2021), Donut, Nougat — state-of-the-art for structured documents
- LLM-based document understanding: GPT-4V, Claude vision can interpret documents directly from images, bypassing traditional OCR pipelines entirely
- Especially powerful for messy layouts, handwriting, and multilingual documents
OCR in R with Tesseract
library(tesseract)

# Basic OCR on an image
text <- ocr("path/to/scanned_page.png")
cat(text)

# With language specification
eng <- tesseract("eng")
text <- ocr("path/to/document.png", engine = eng)

# Get word-level bounding boxes (useful for structured extraction)
words <- ocr_data("path/to/document.png")
head(words)  # columns: word, confidence, bbox
Wind of Change — Lloyd’s list
Idea
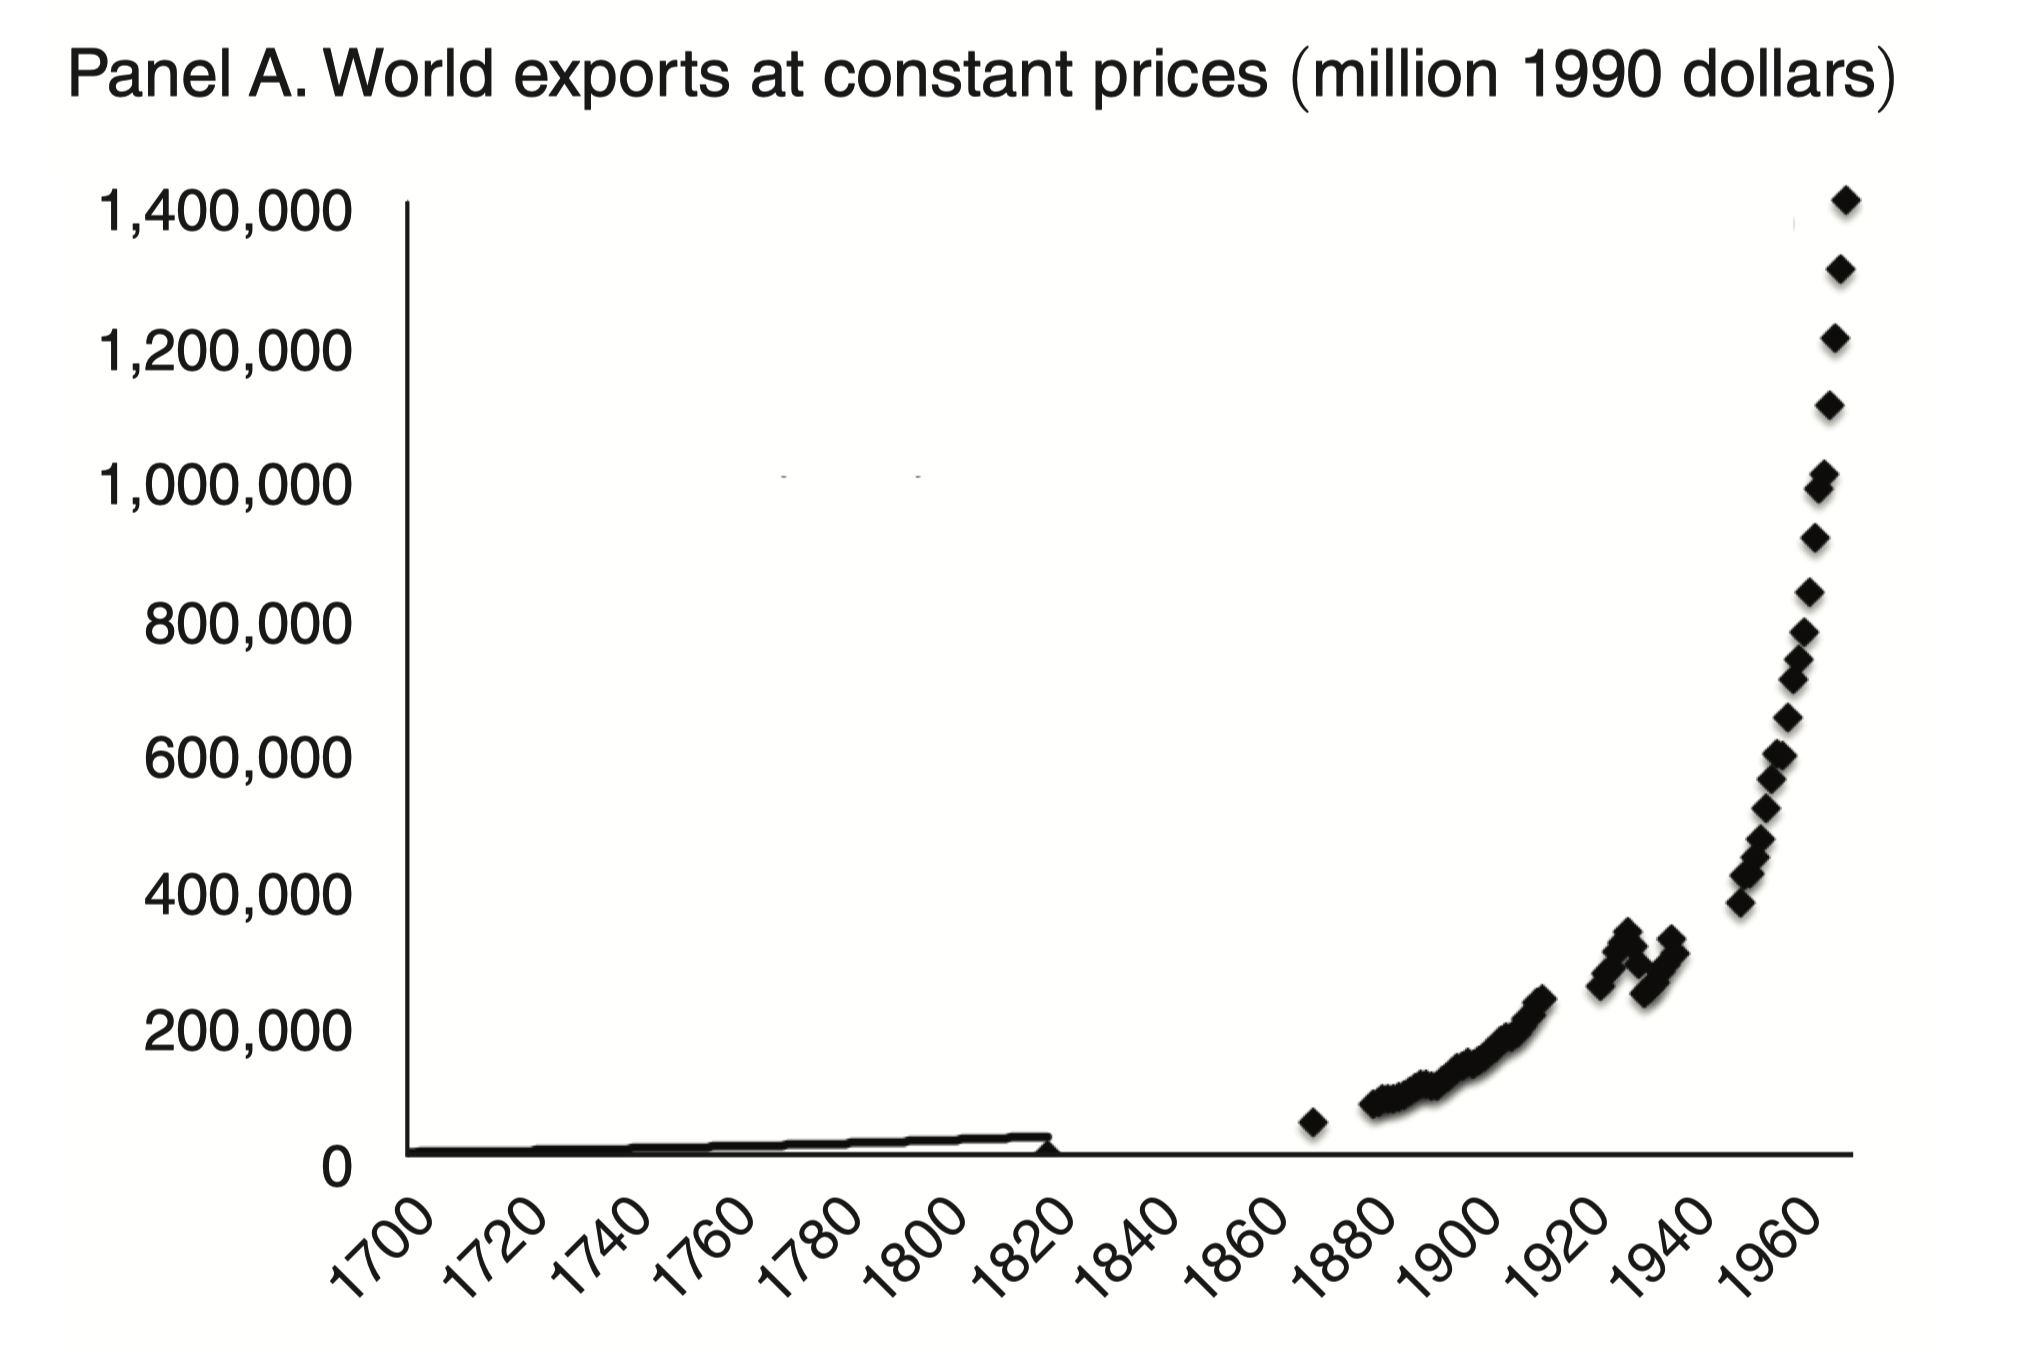
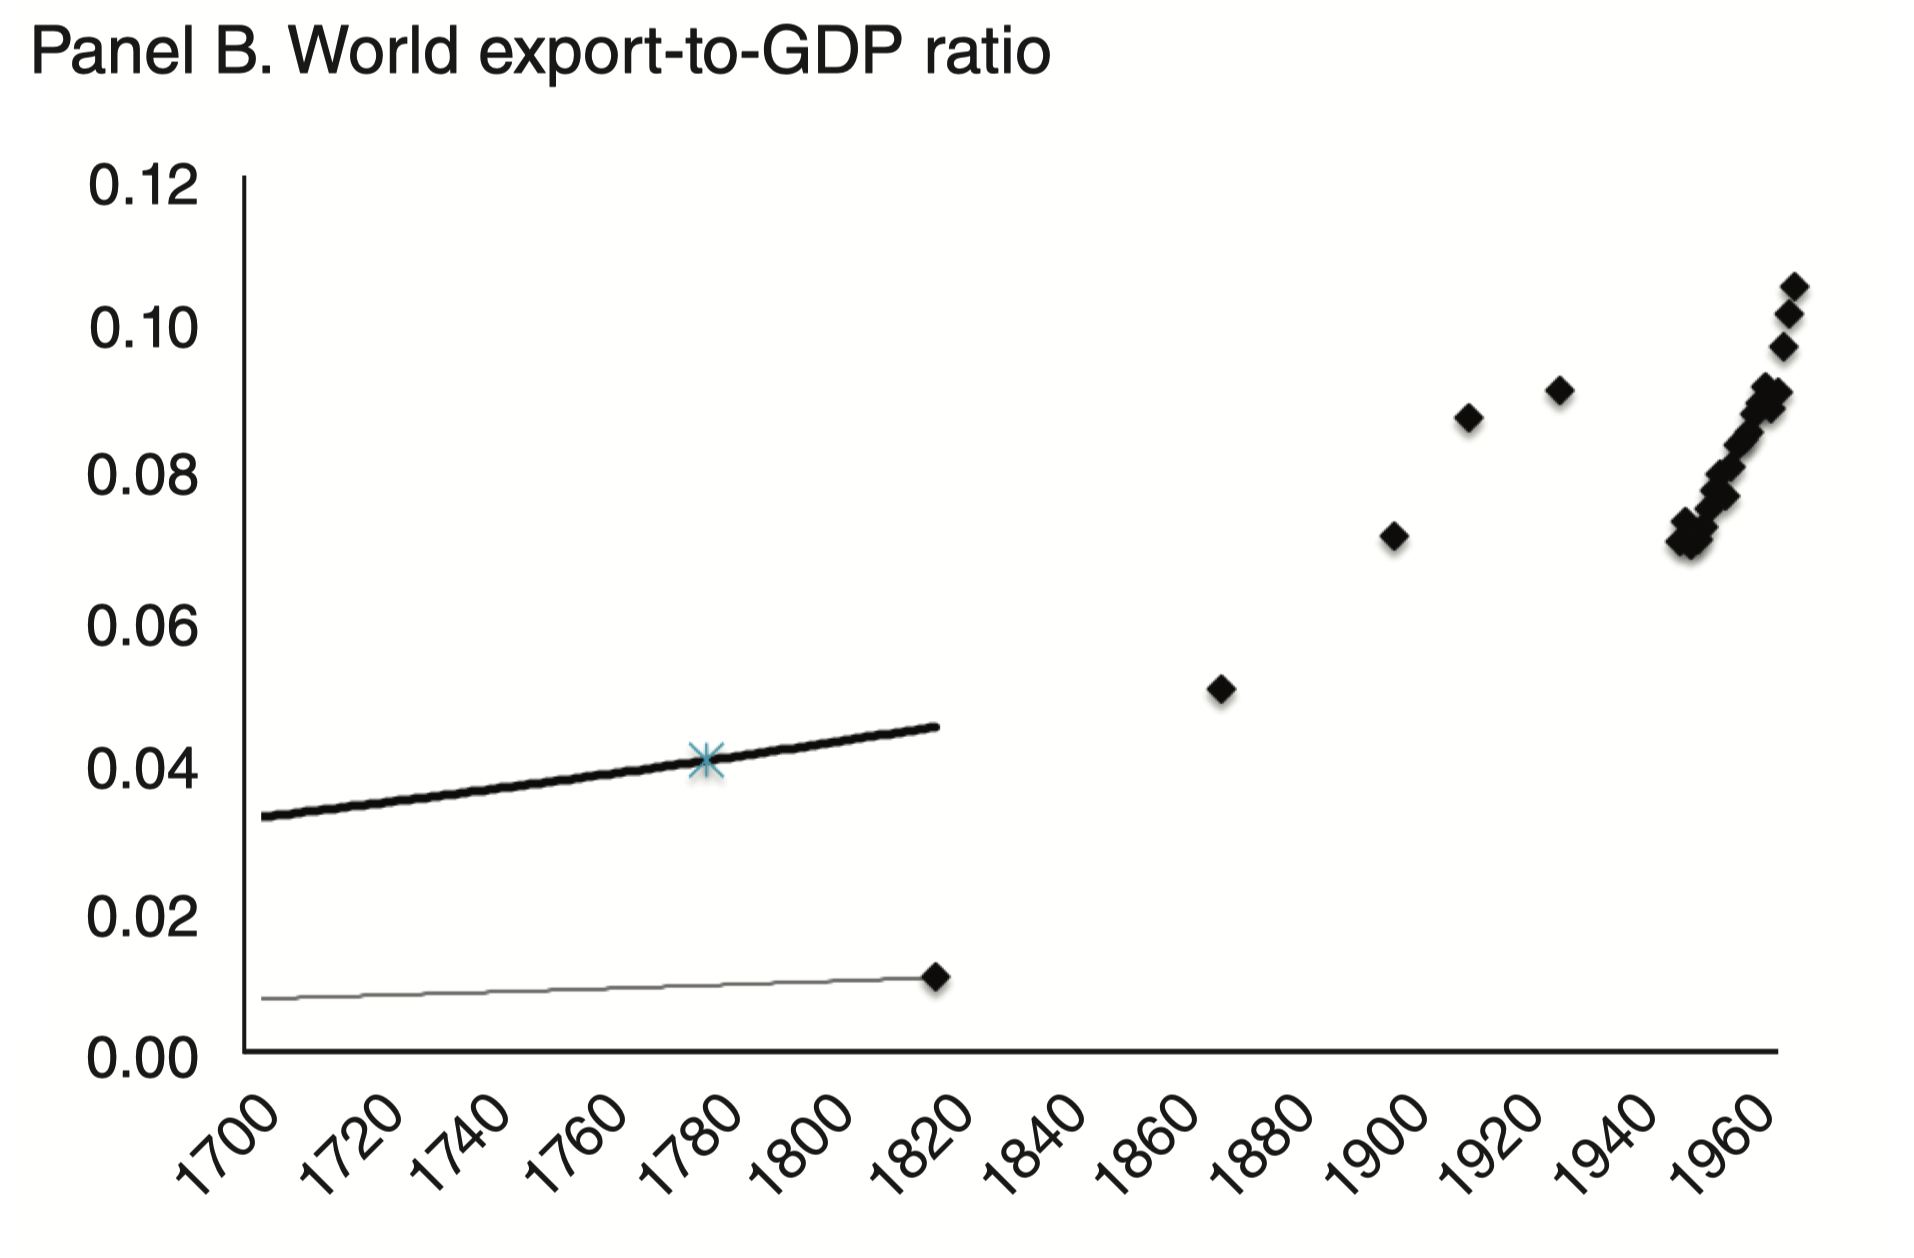
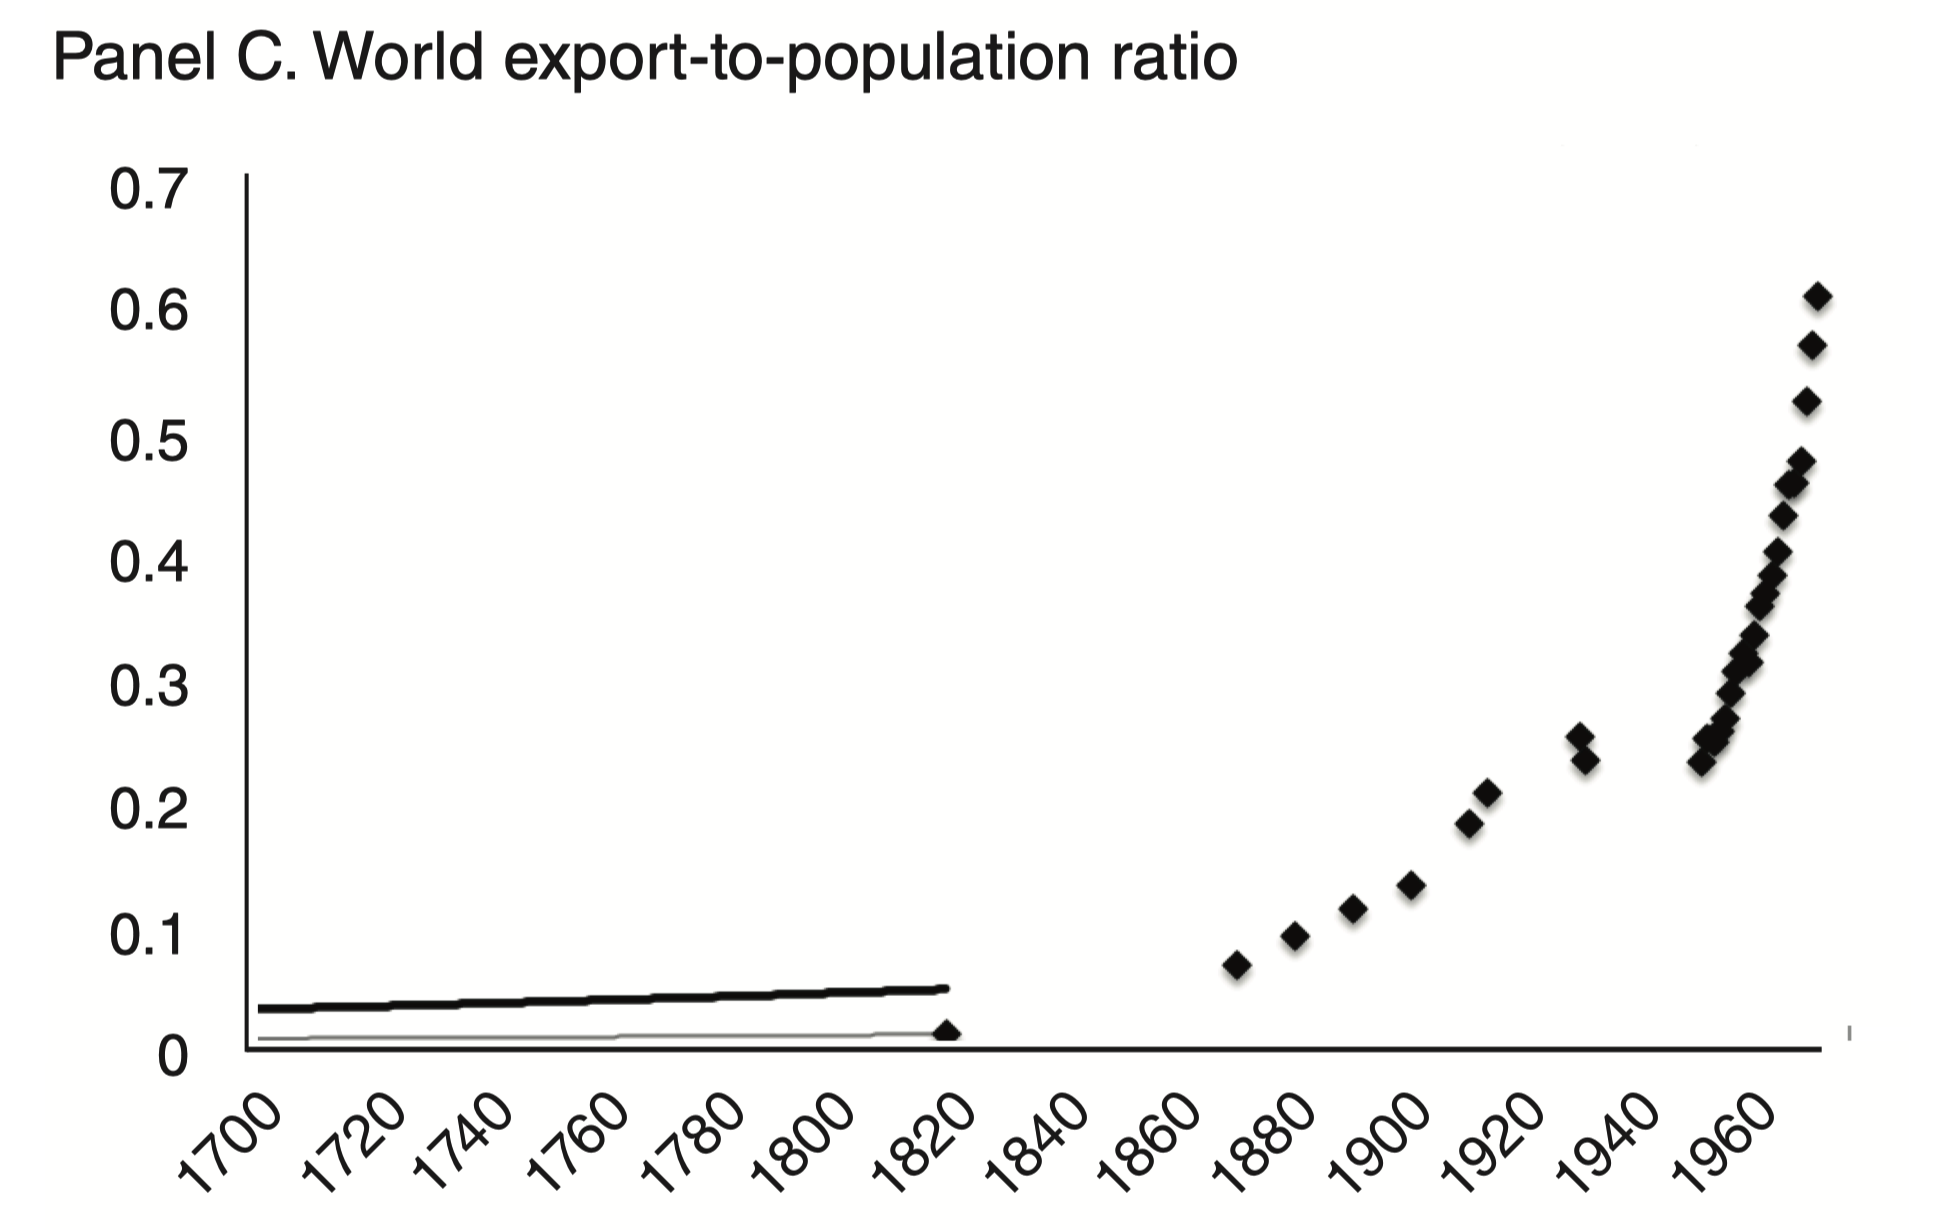
- 1870–1913 first era of trade globalization
- How did the increase in trade affect economic development?
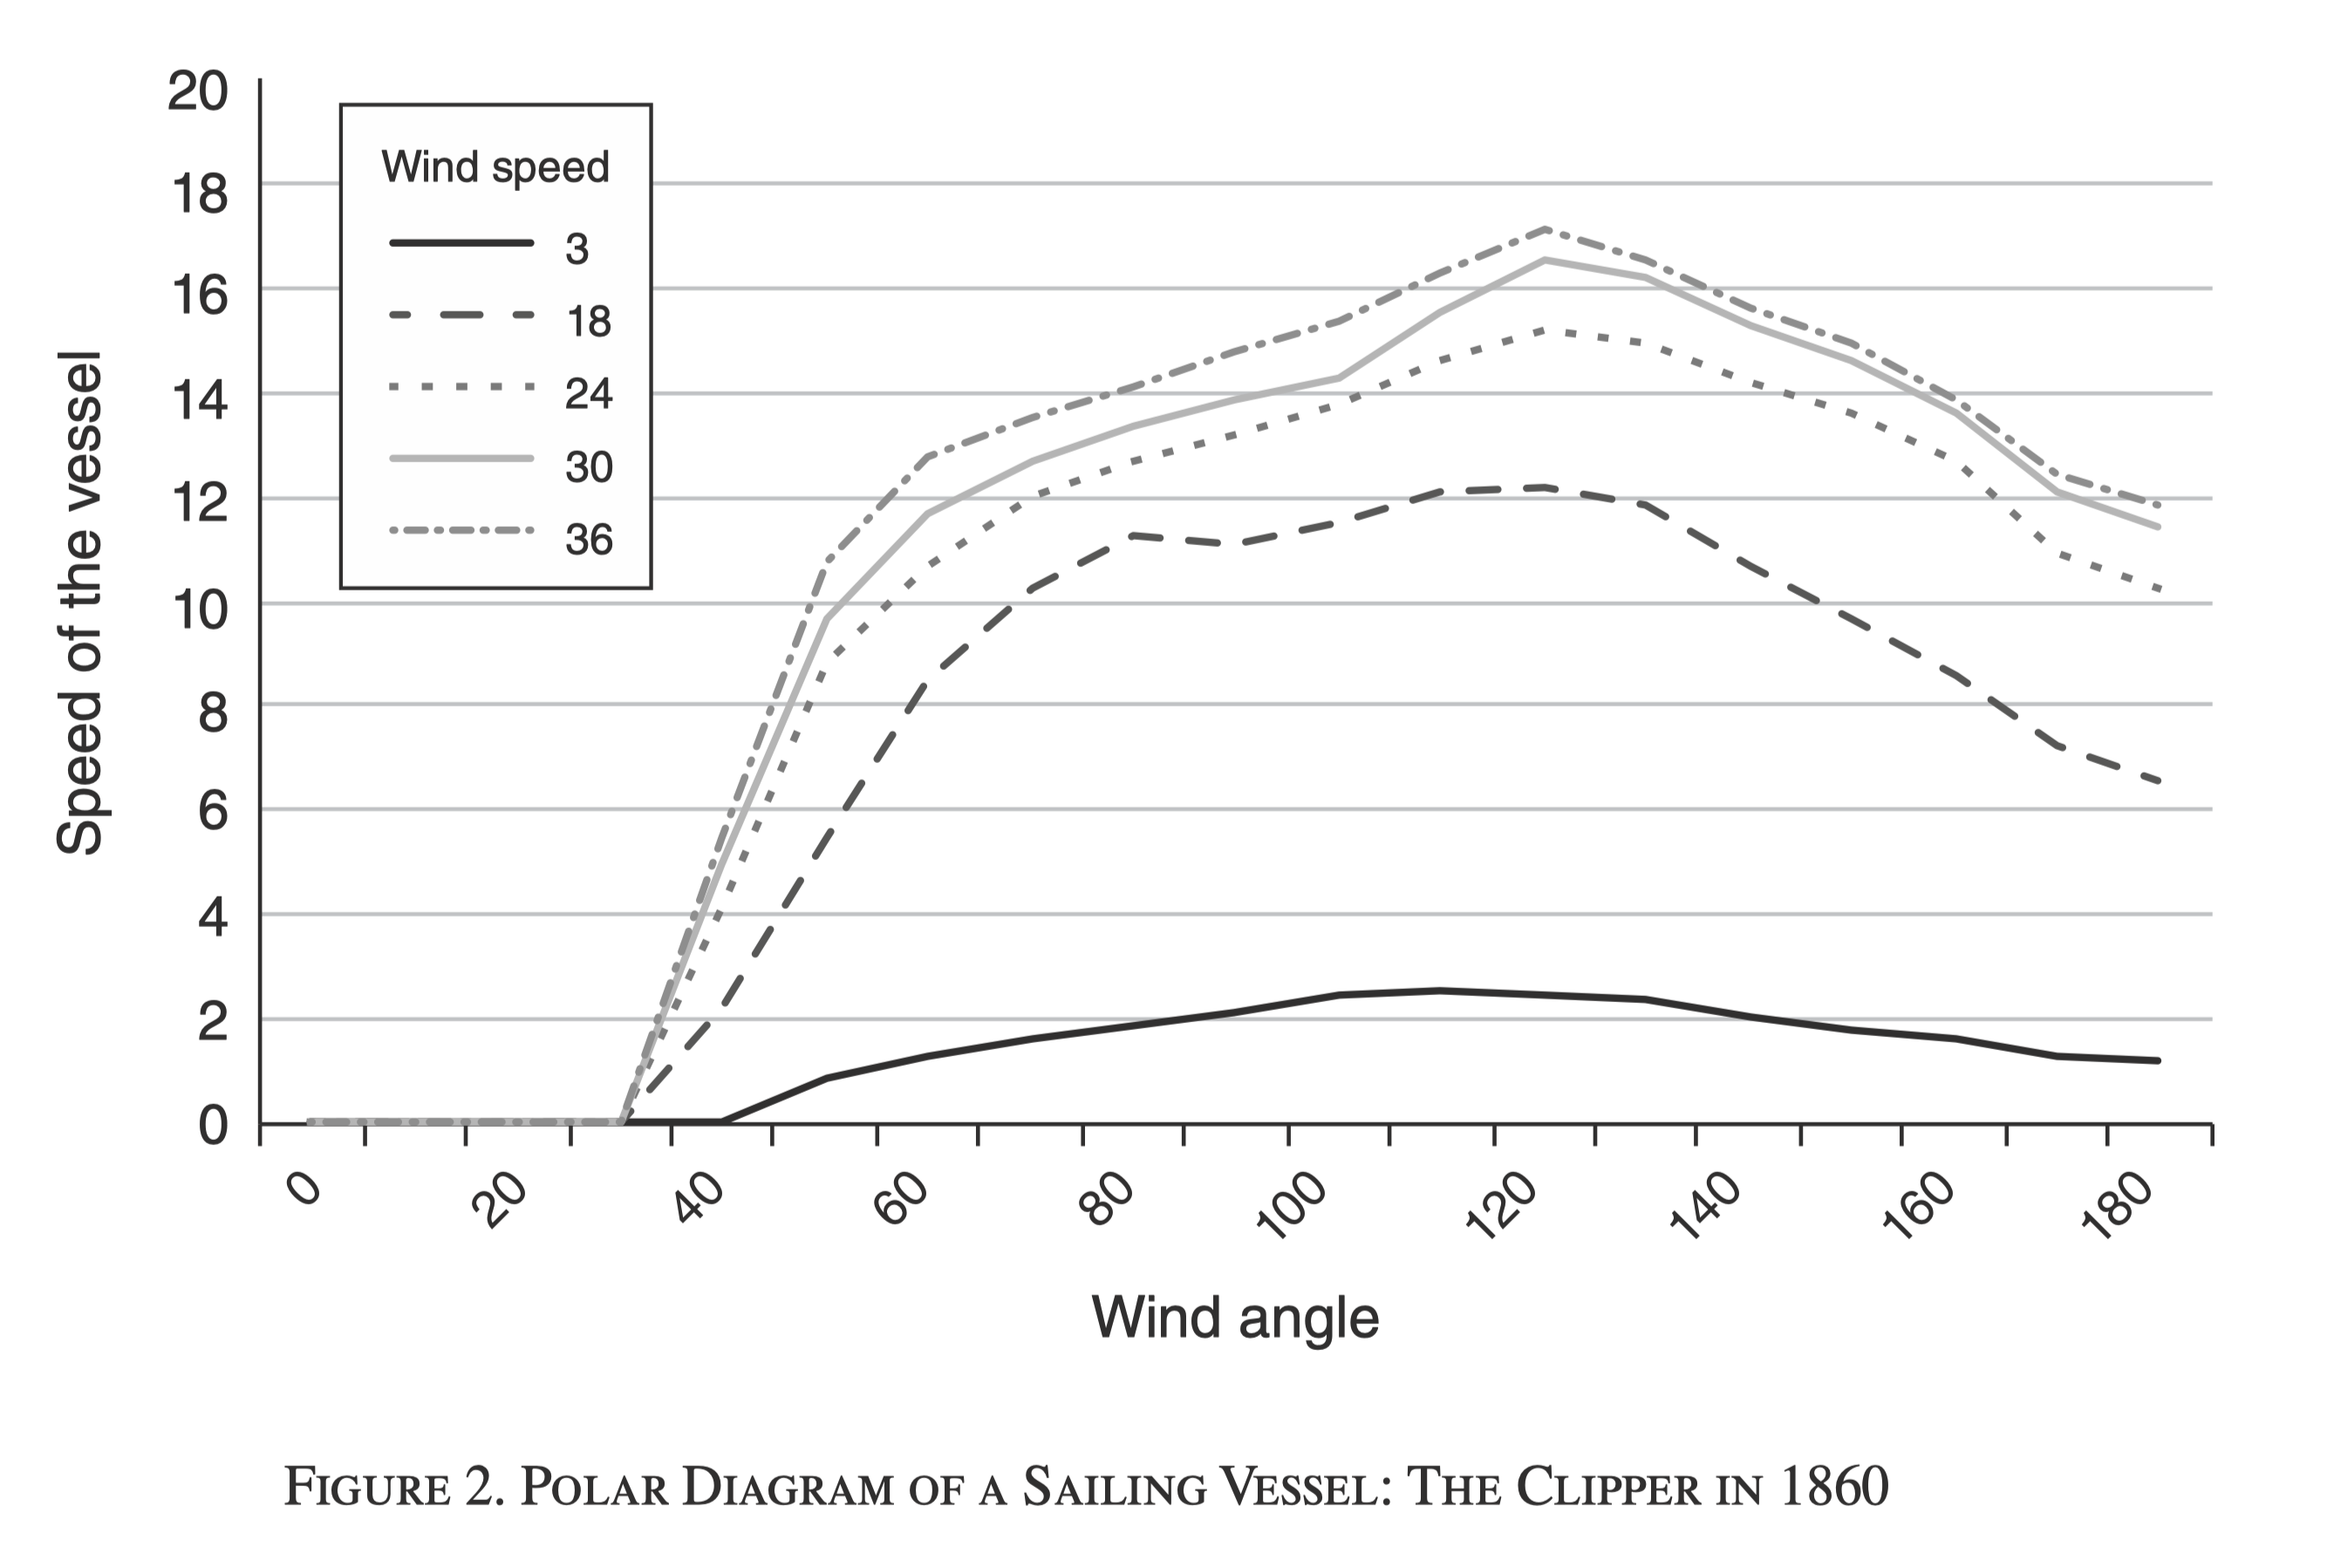
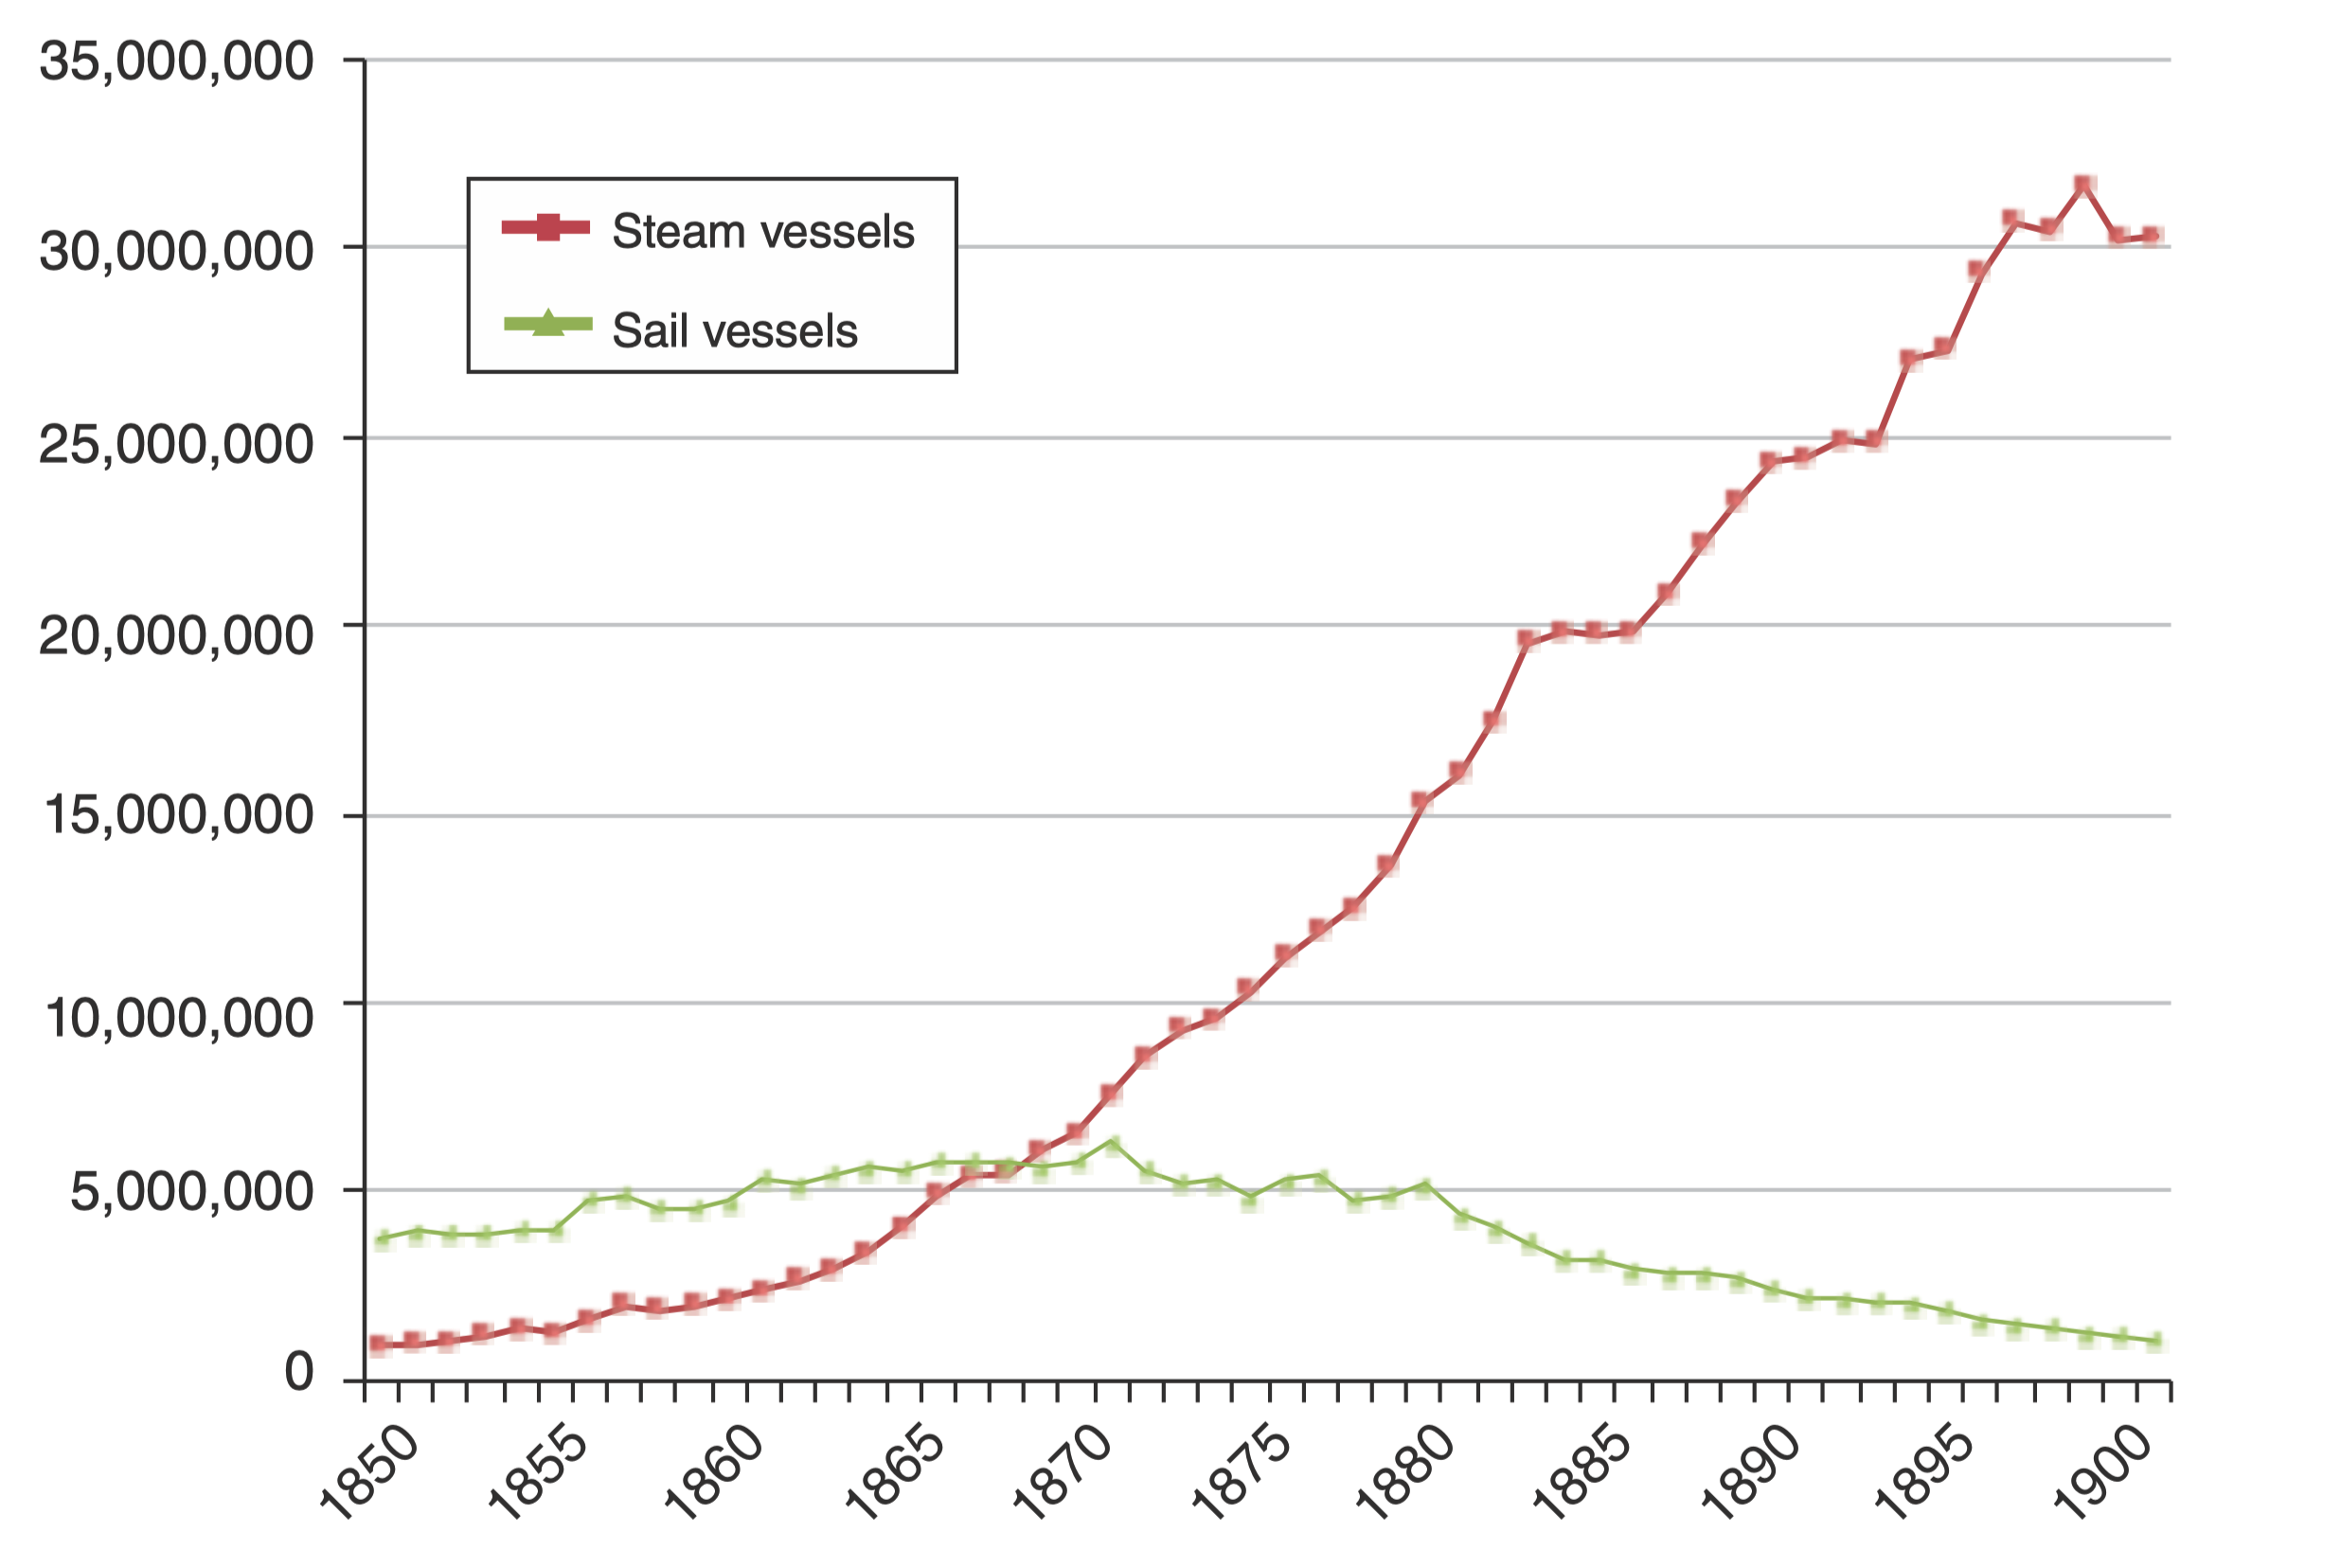
- Causal mechanism: steamship vs. sailing
- Asymmetric change in trade distances among countries
- Steamship reduced shipping costs and time heterogeneously across countries and trade routes
Digitized data
- Three novel datasets from 1850 to 1900
- First dataset: shipping times across 16,000 country pairs
- Second dataset: 23,000 bilateral trade observations, 1,000 distinct country pairs
- Sectoral-level export data for 37 countries
- Third dataset: freight rates across 291 shipping routes
Effect on trade and GDP
- Impact of steamship on world trade volumes
- Reduction in geographical isolation measured by average shipping time
- Country-level regressions estimate impact of change in isolation
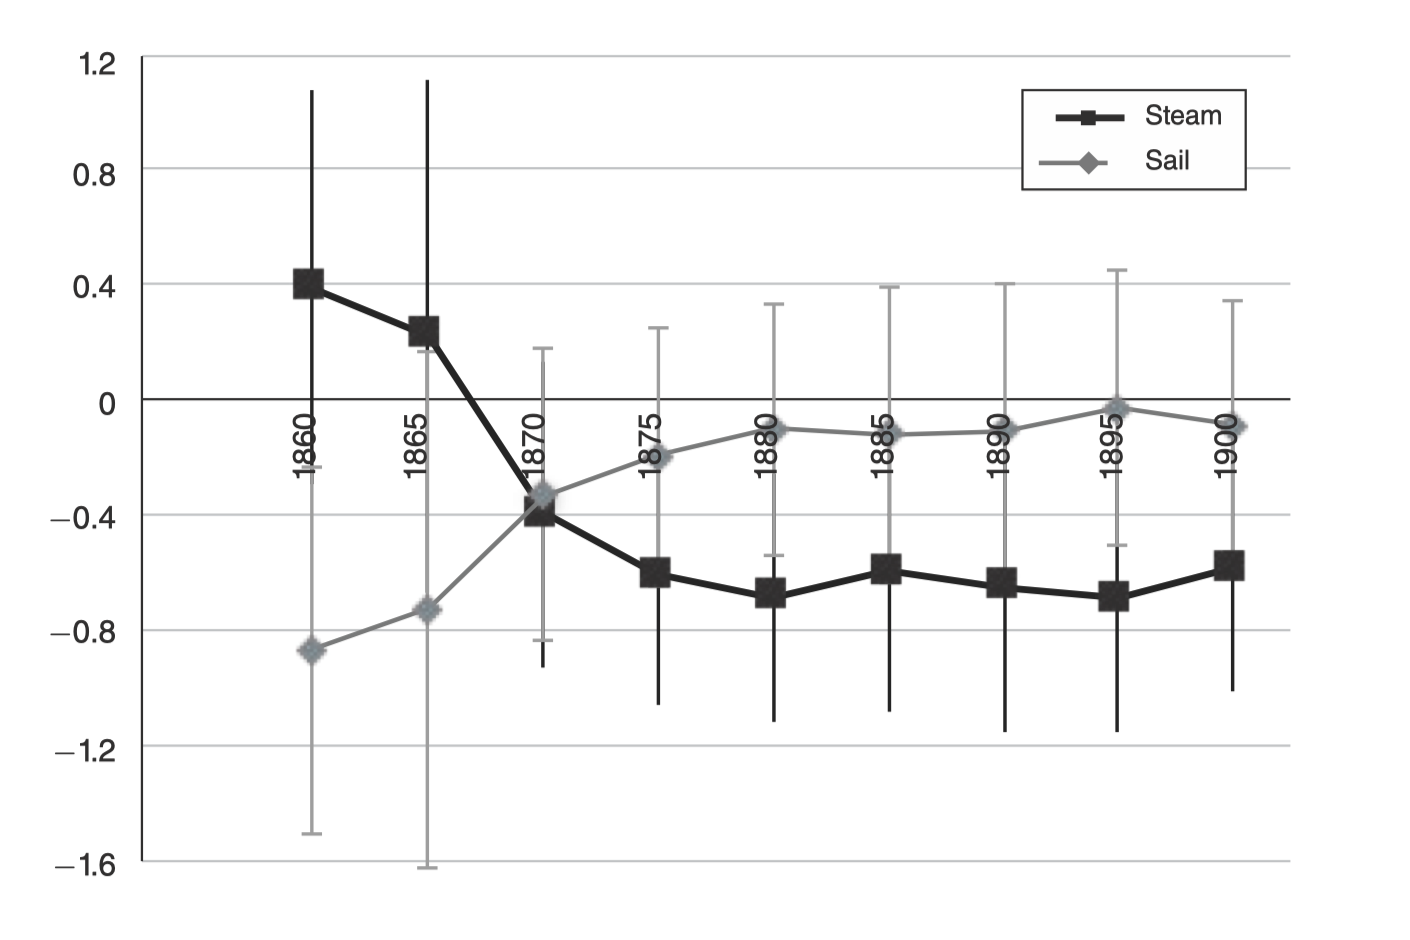
Findings
- Rich countries did not benefit on average
- Similar impact of trade on agricultural and non-agricultural countries
- Institutions might reflect economic development differences
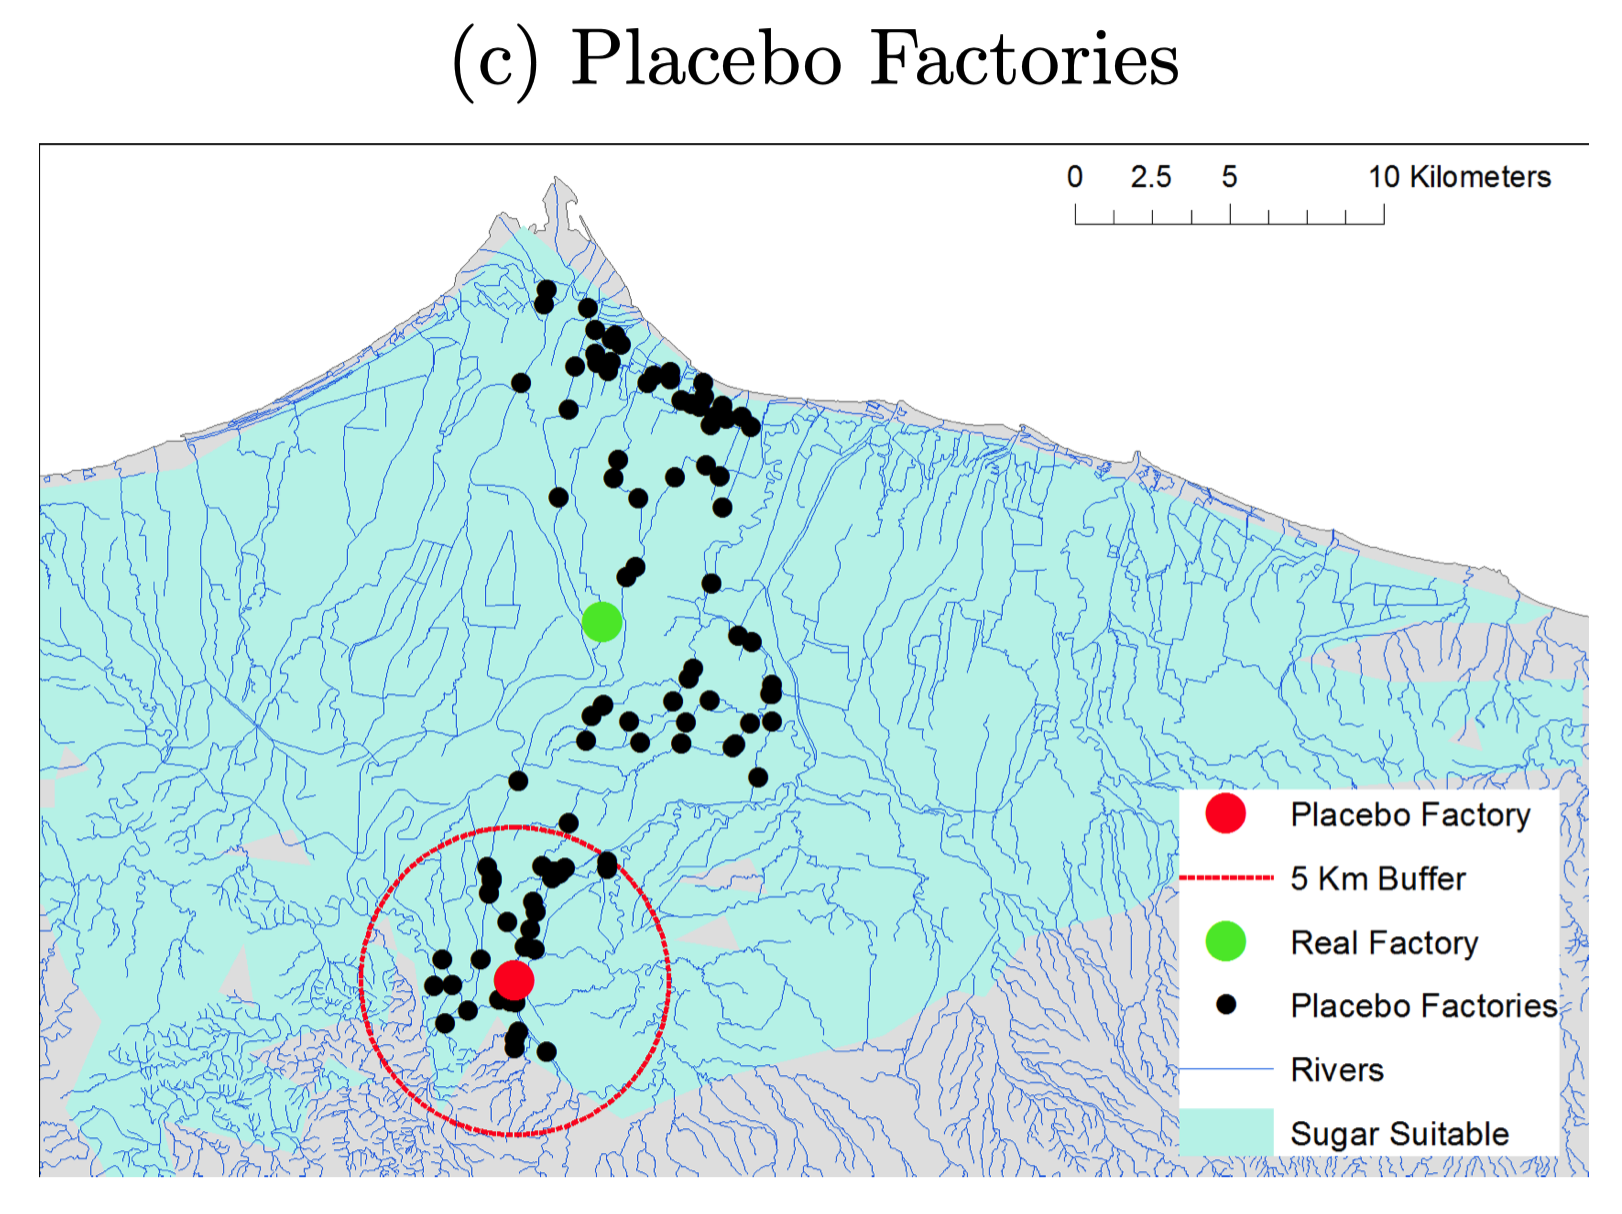
Dutch Colonies
- Investigates Dutch Cultivation System impacts
- Farmers forced to cultivate export crops: Sugar
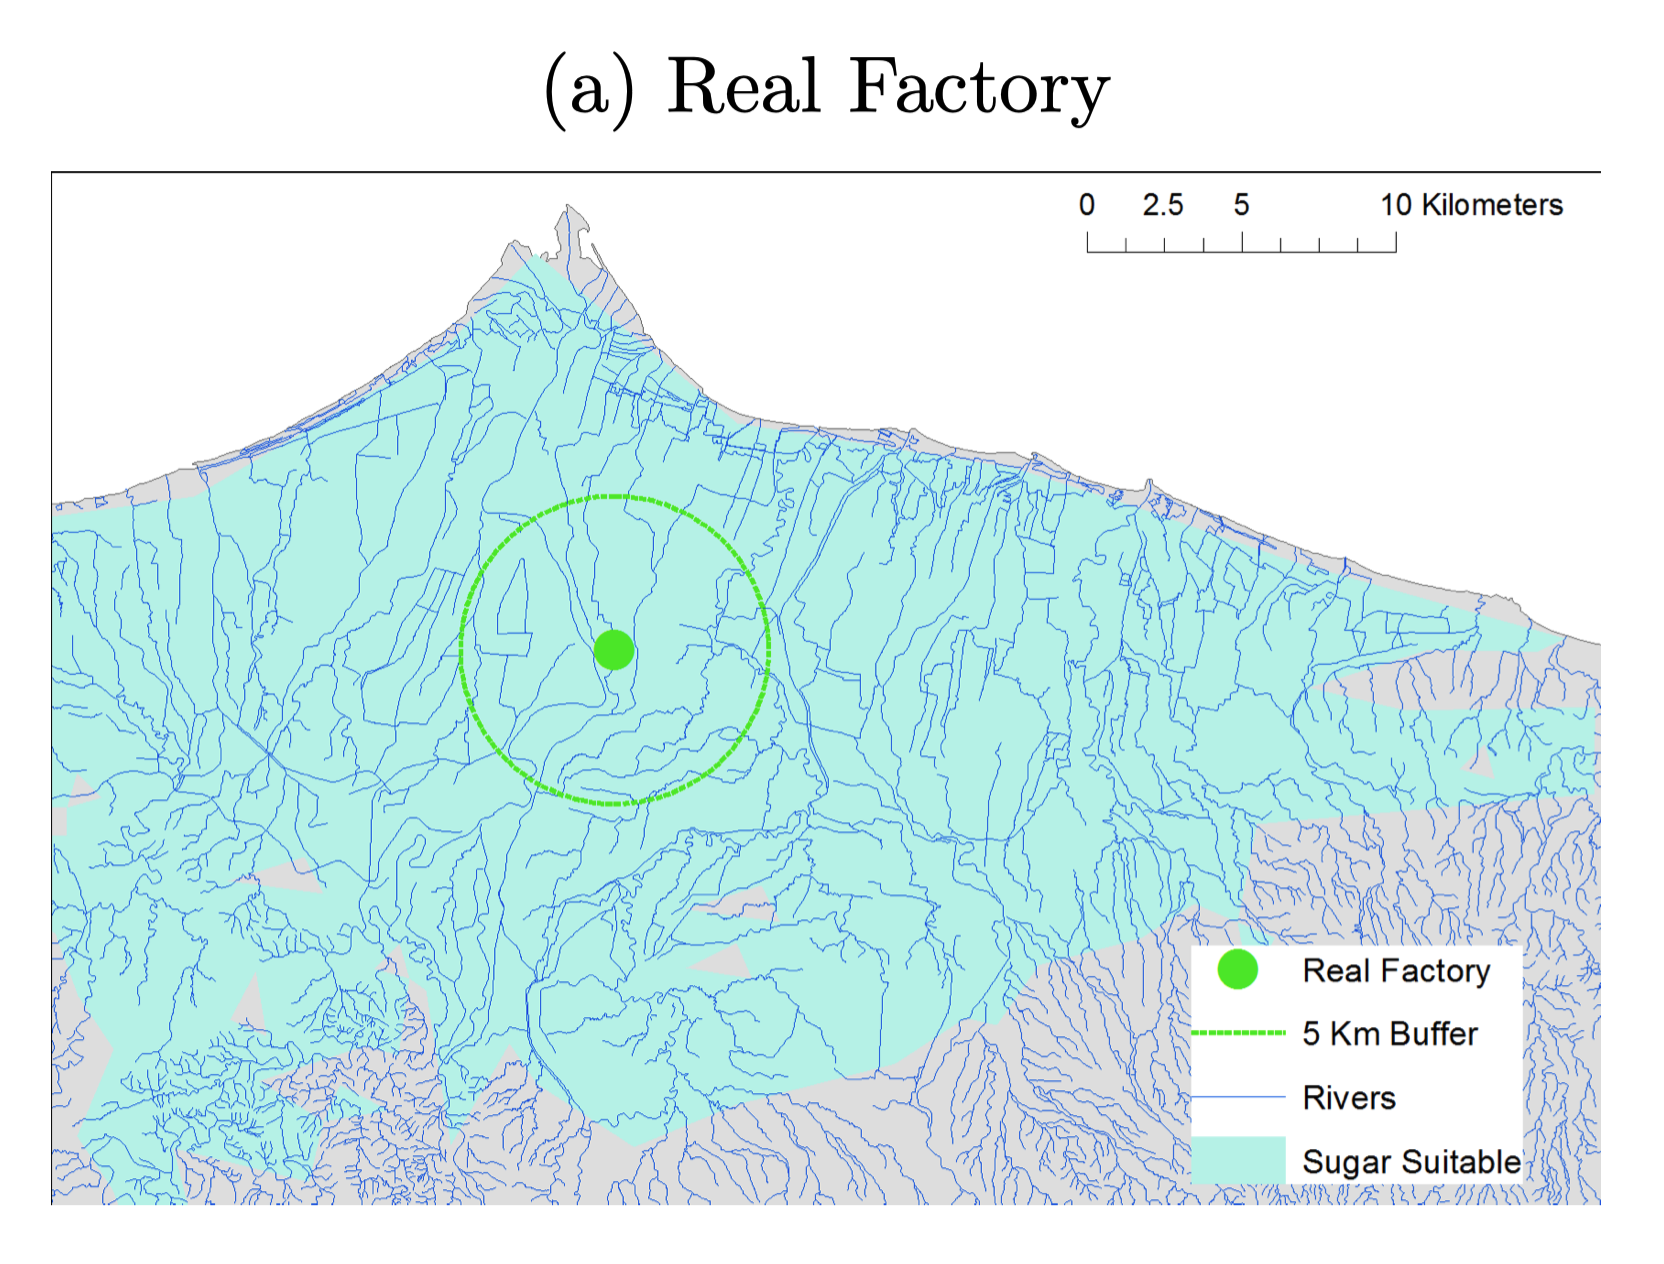
- Areas near factories more industrialized today
- Residents near factories have higher education
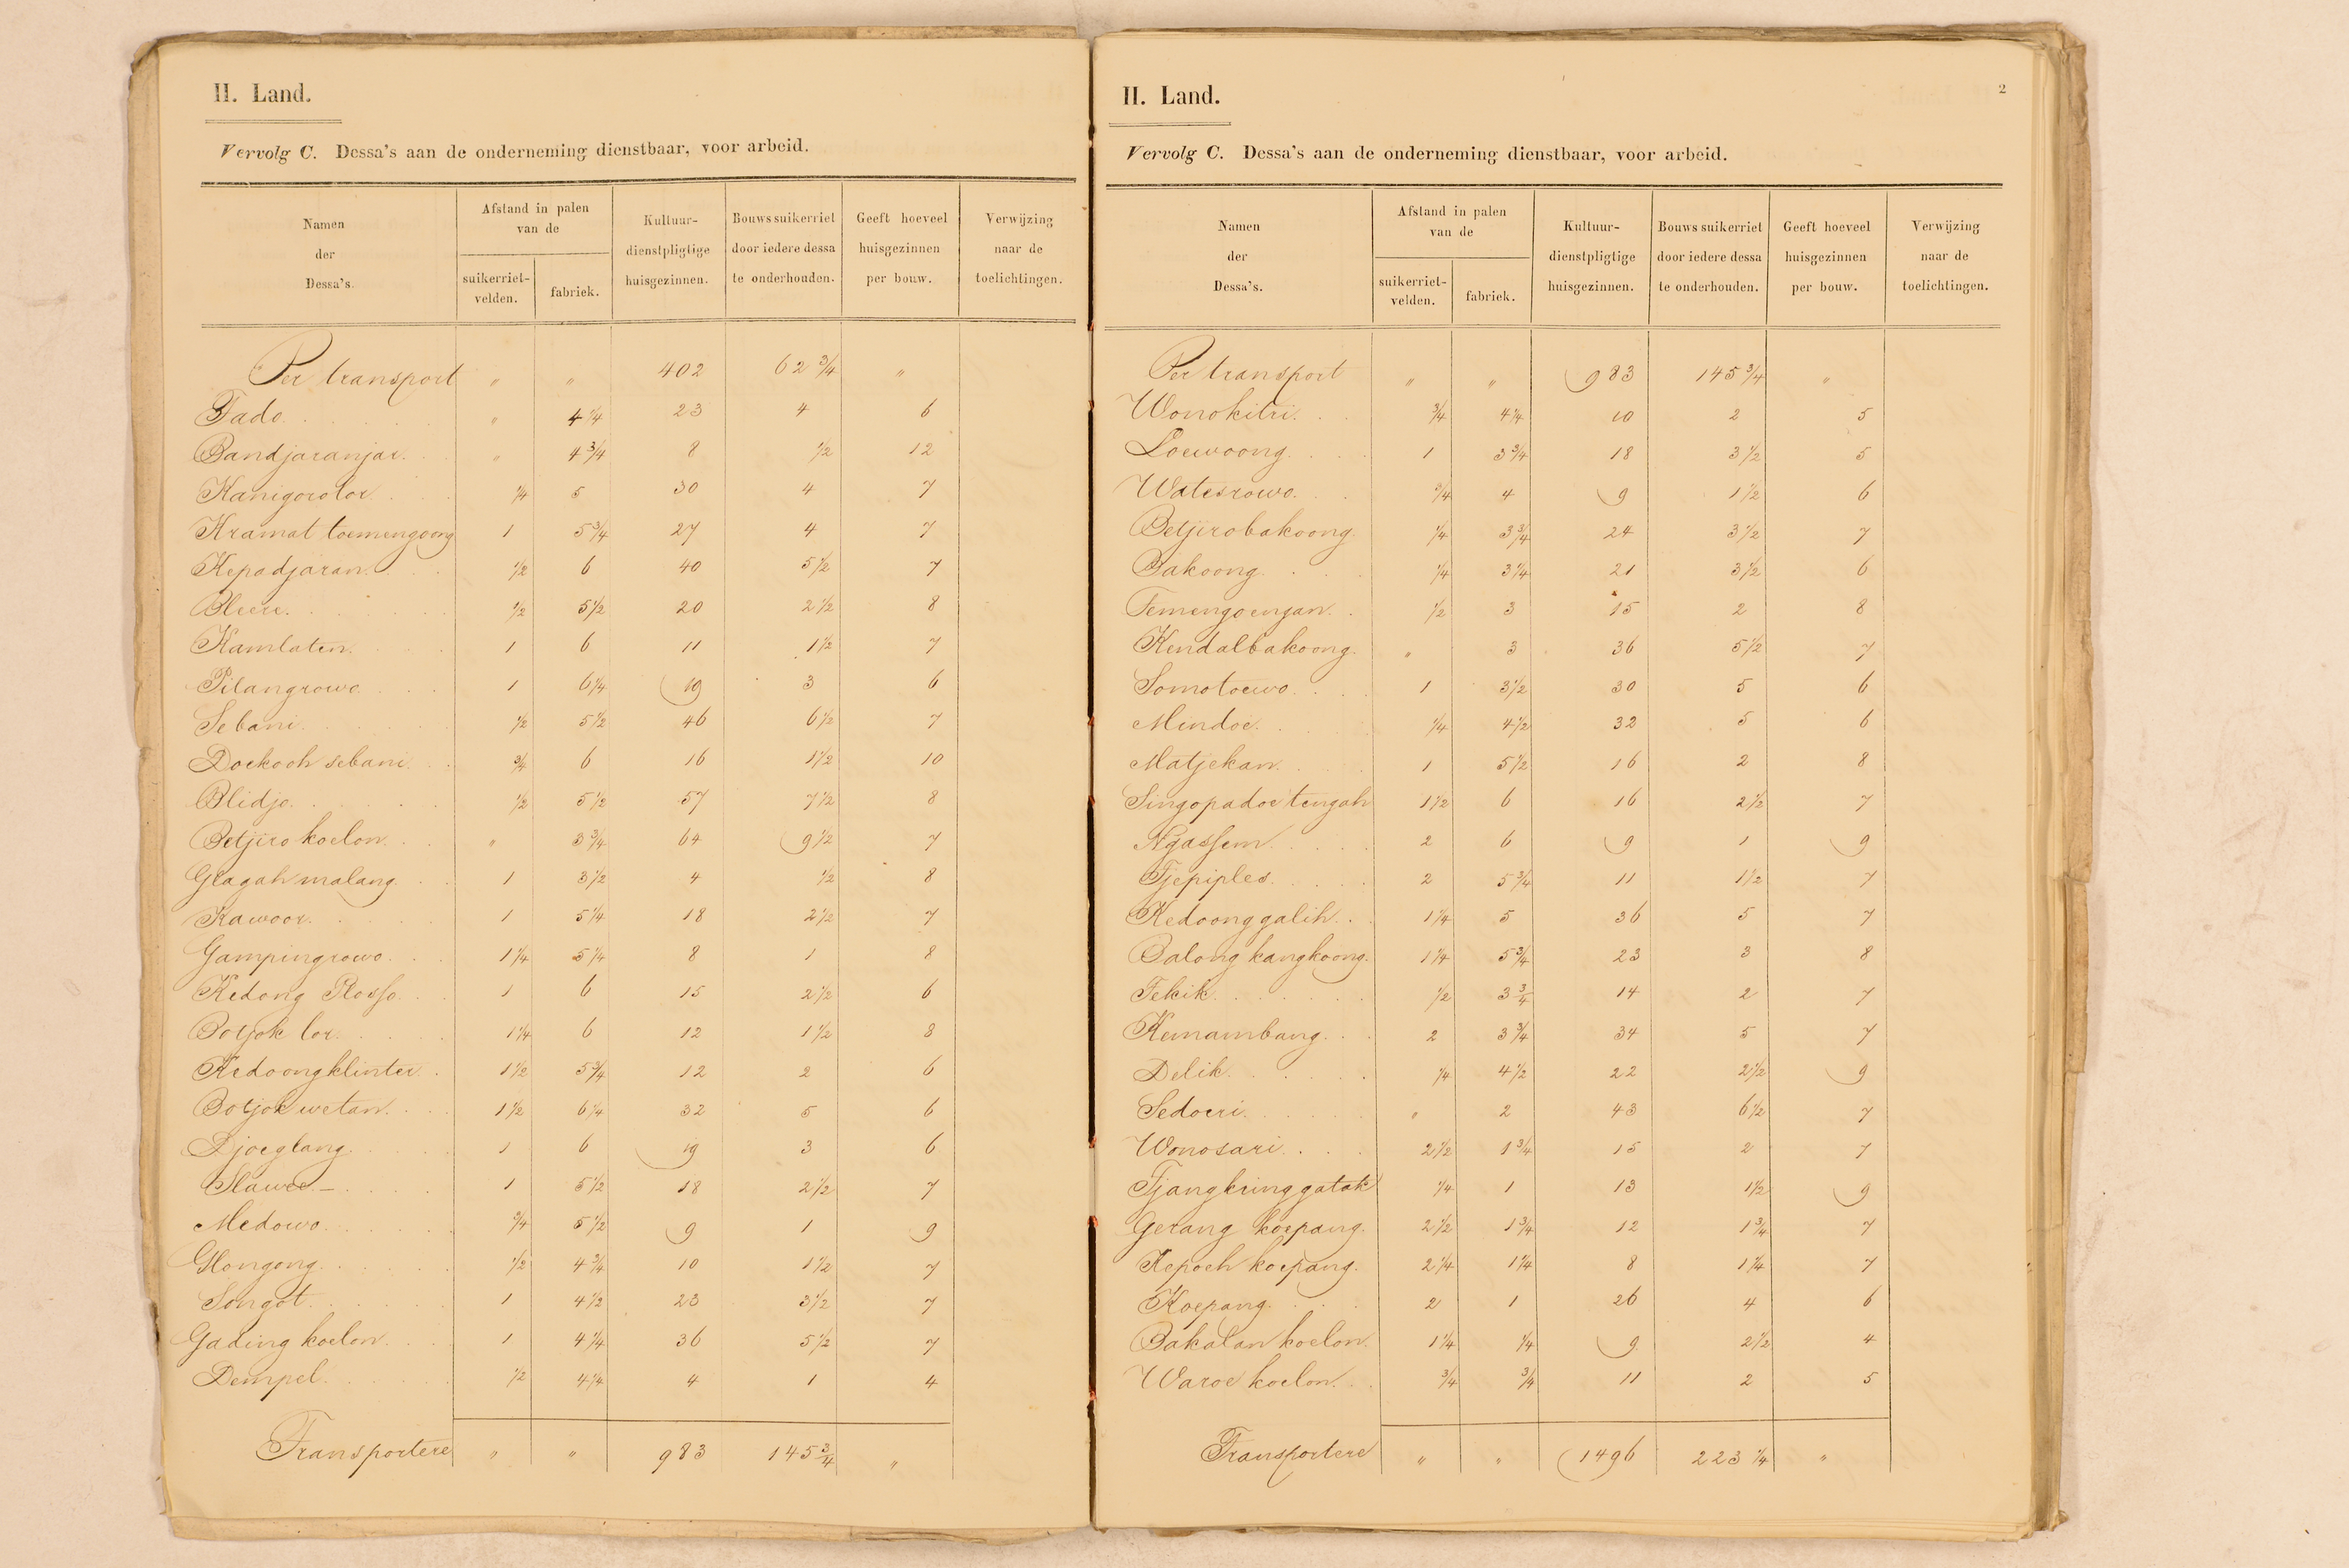
- Data combines historical and contemporary sources
- Traces long-term impacts of Cultivation System
- Geographic distance to factories measures exposure
- Uses contemporary data for long-term impacts
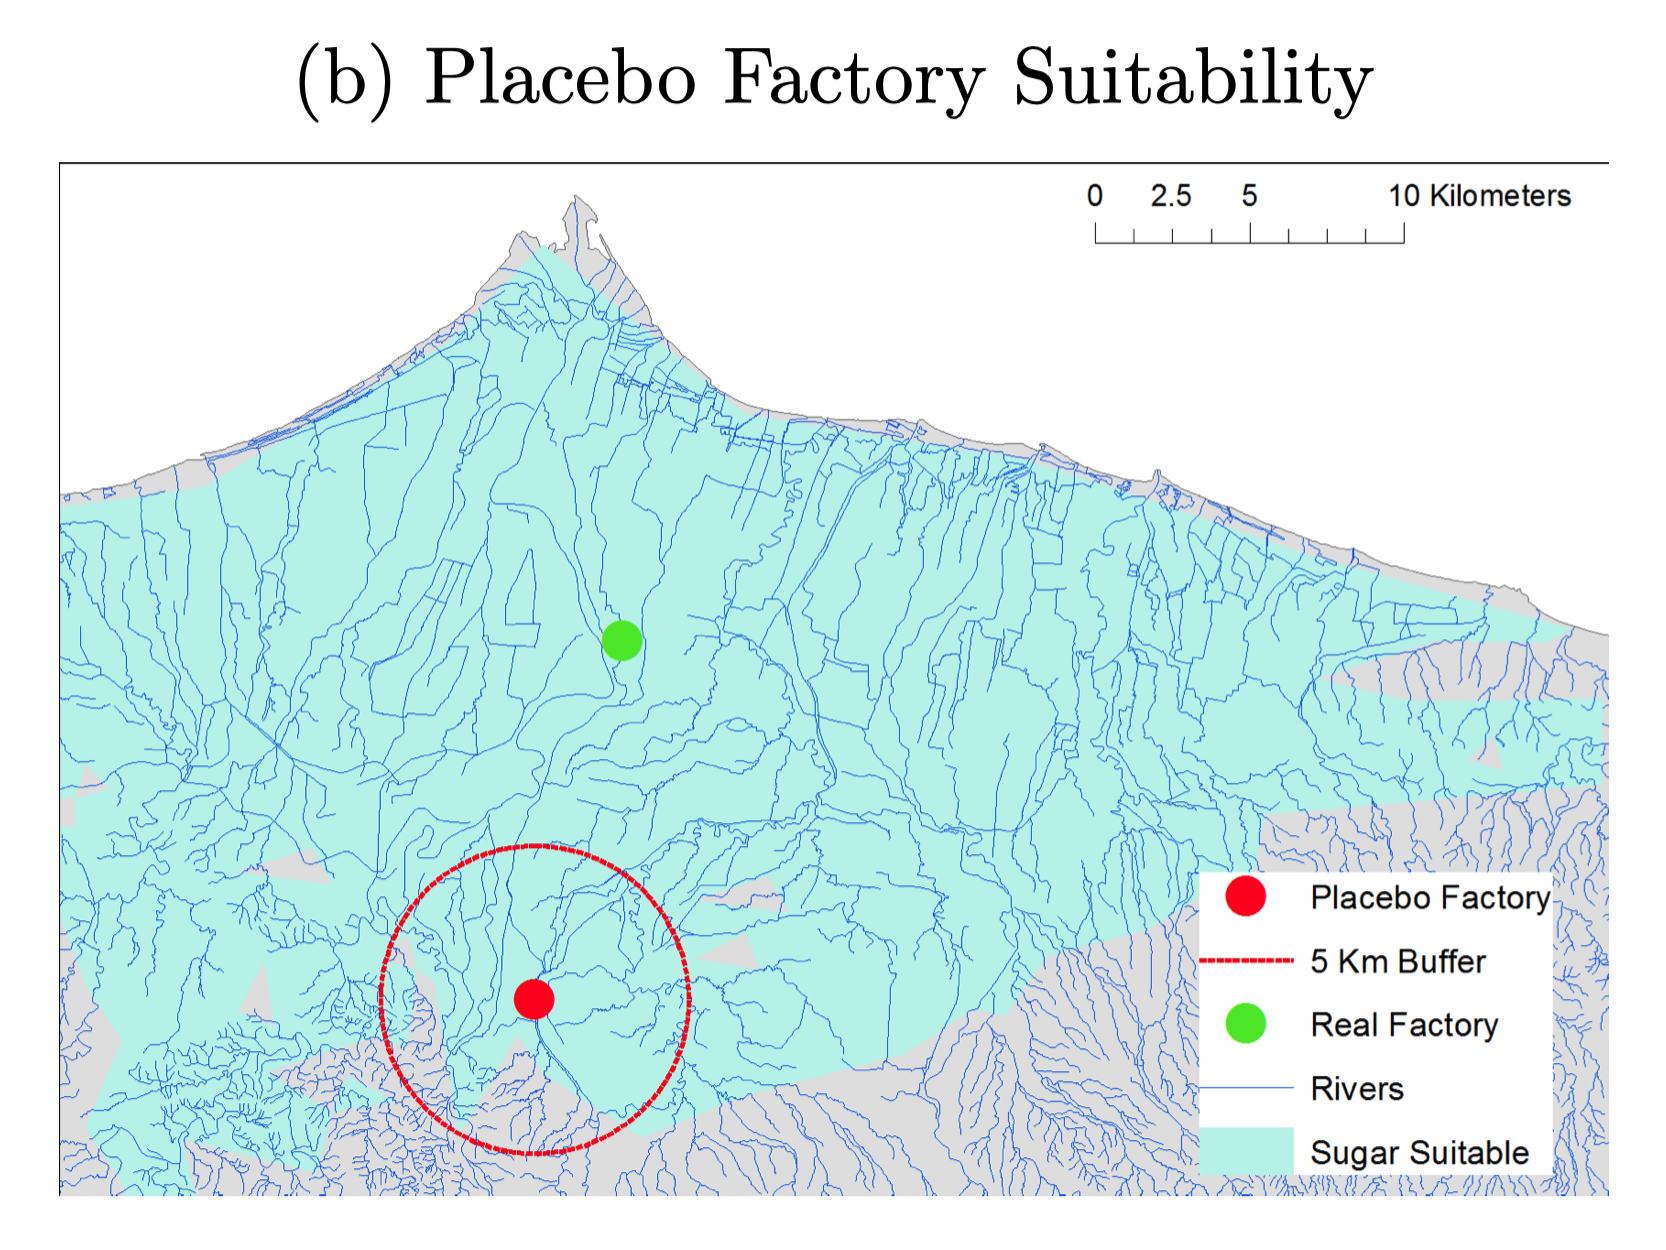
Discussion
- Study focuses on specific colonial institution
- Findings may not generalize to other institutions
- Pre-existing differences between areas not ruled out
- Unobserved factors could influence results
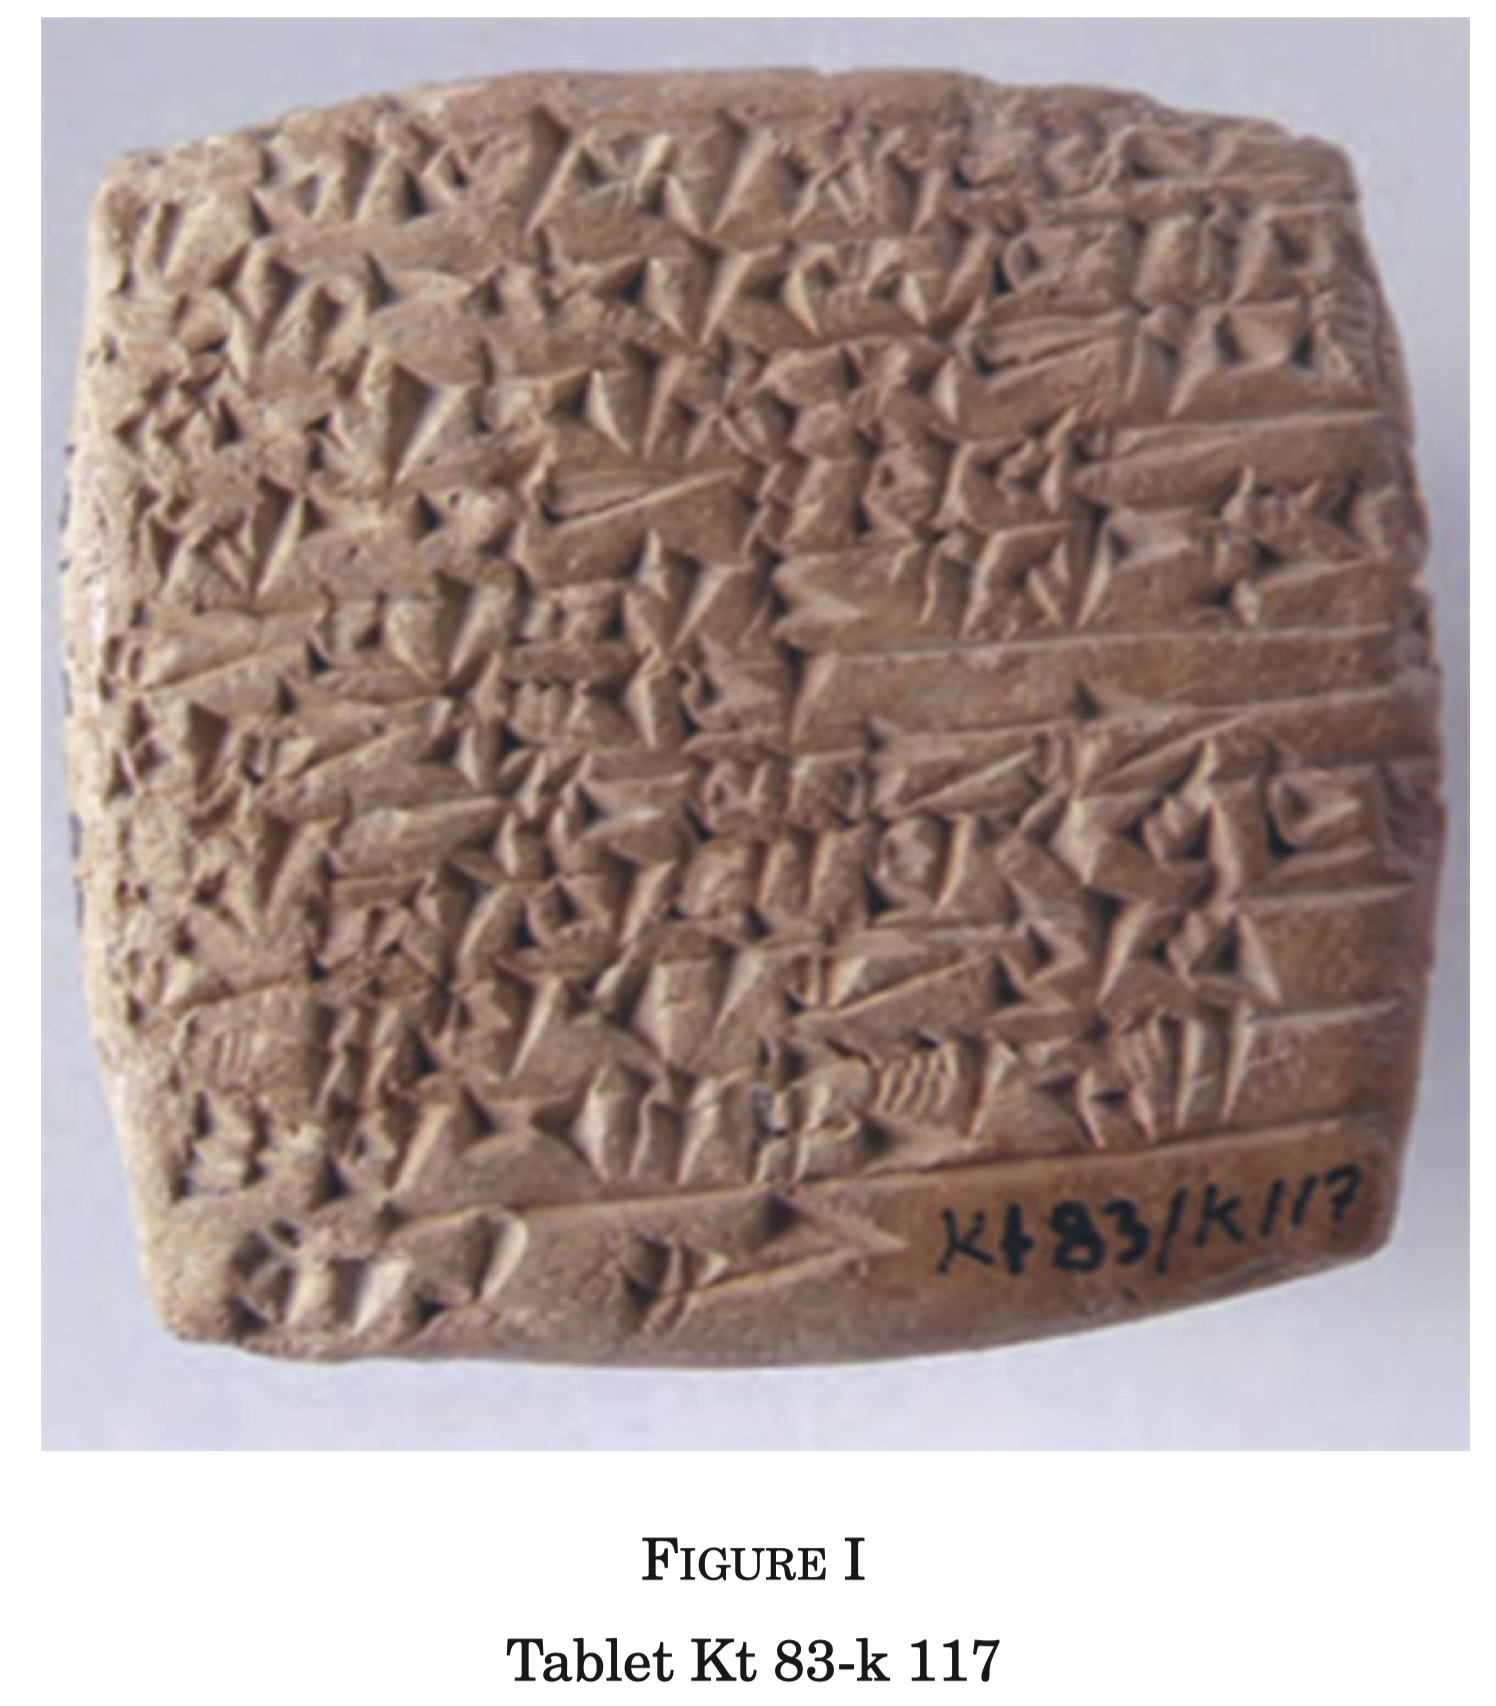
Gravity with Clay Tablets
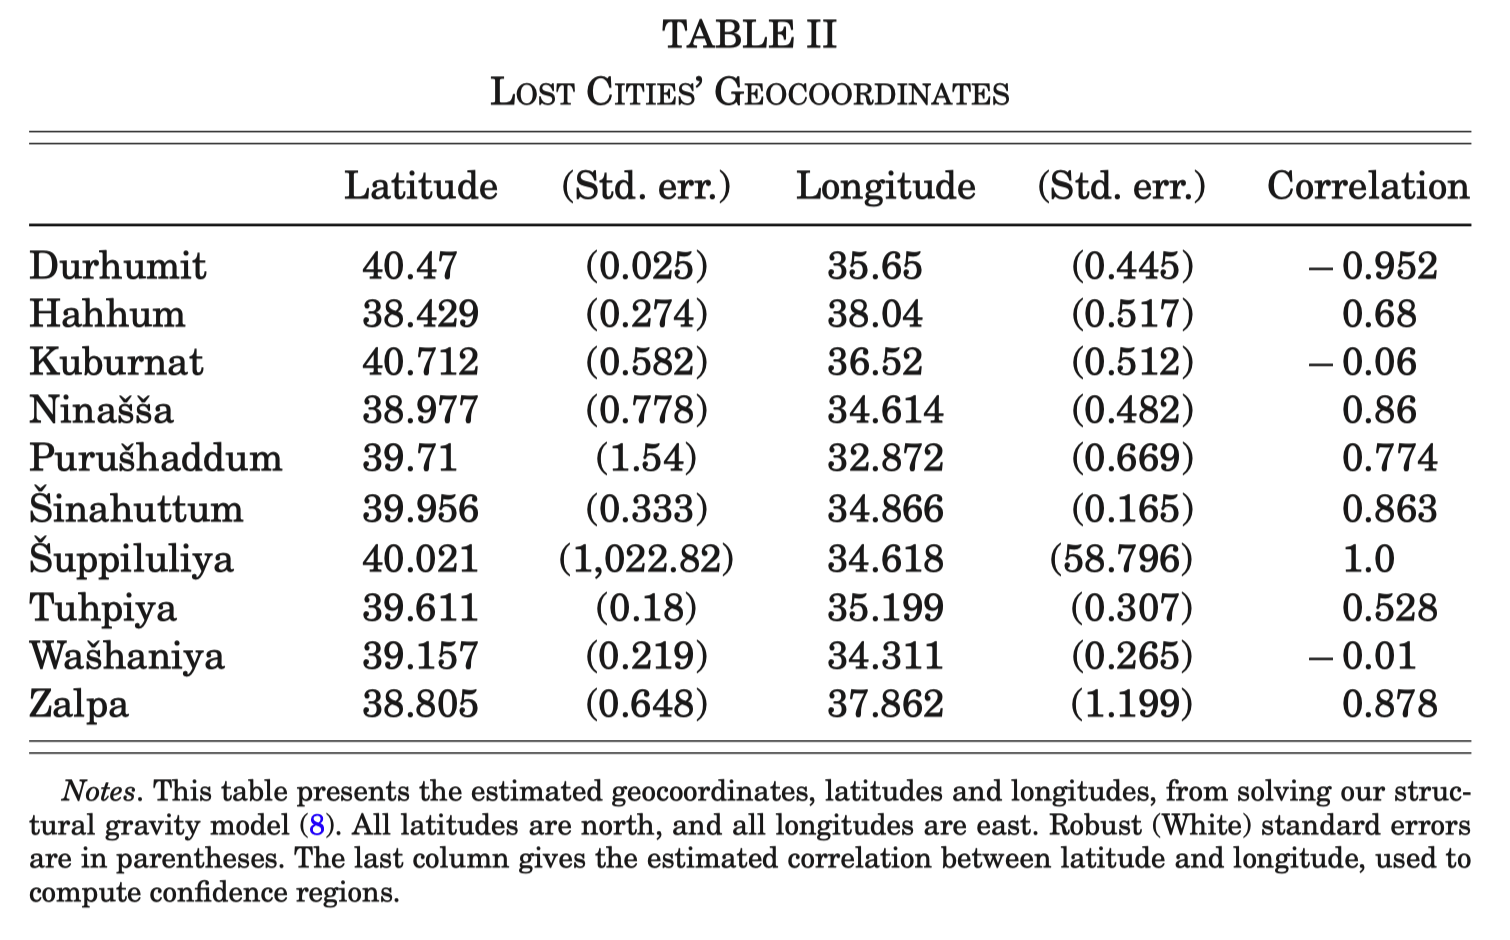
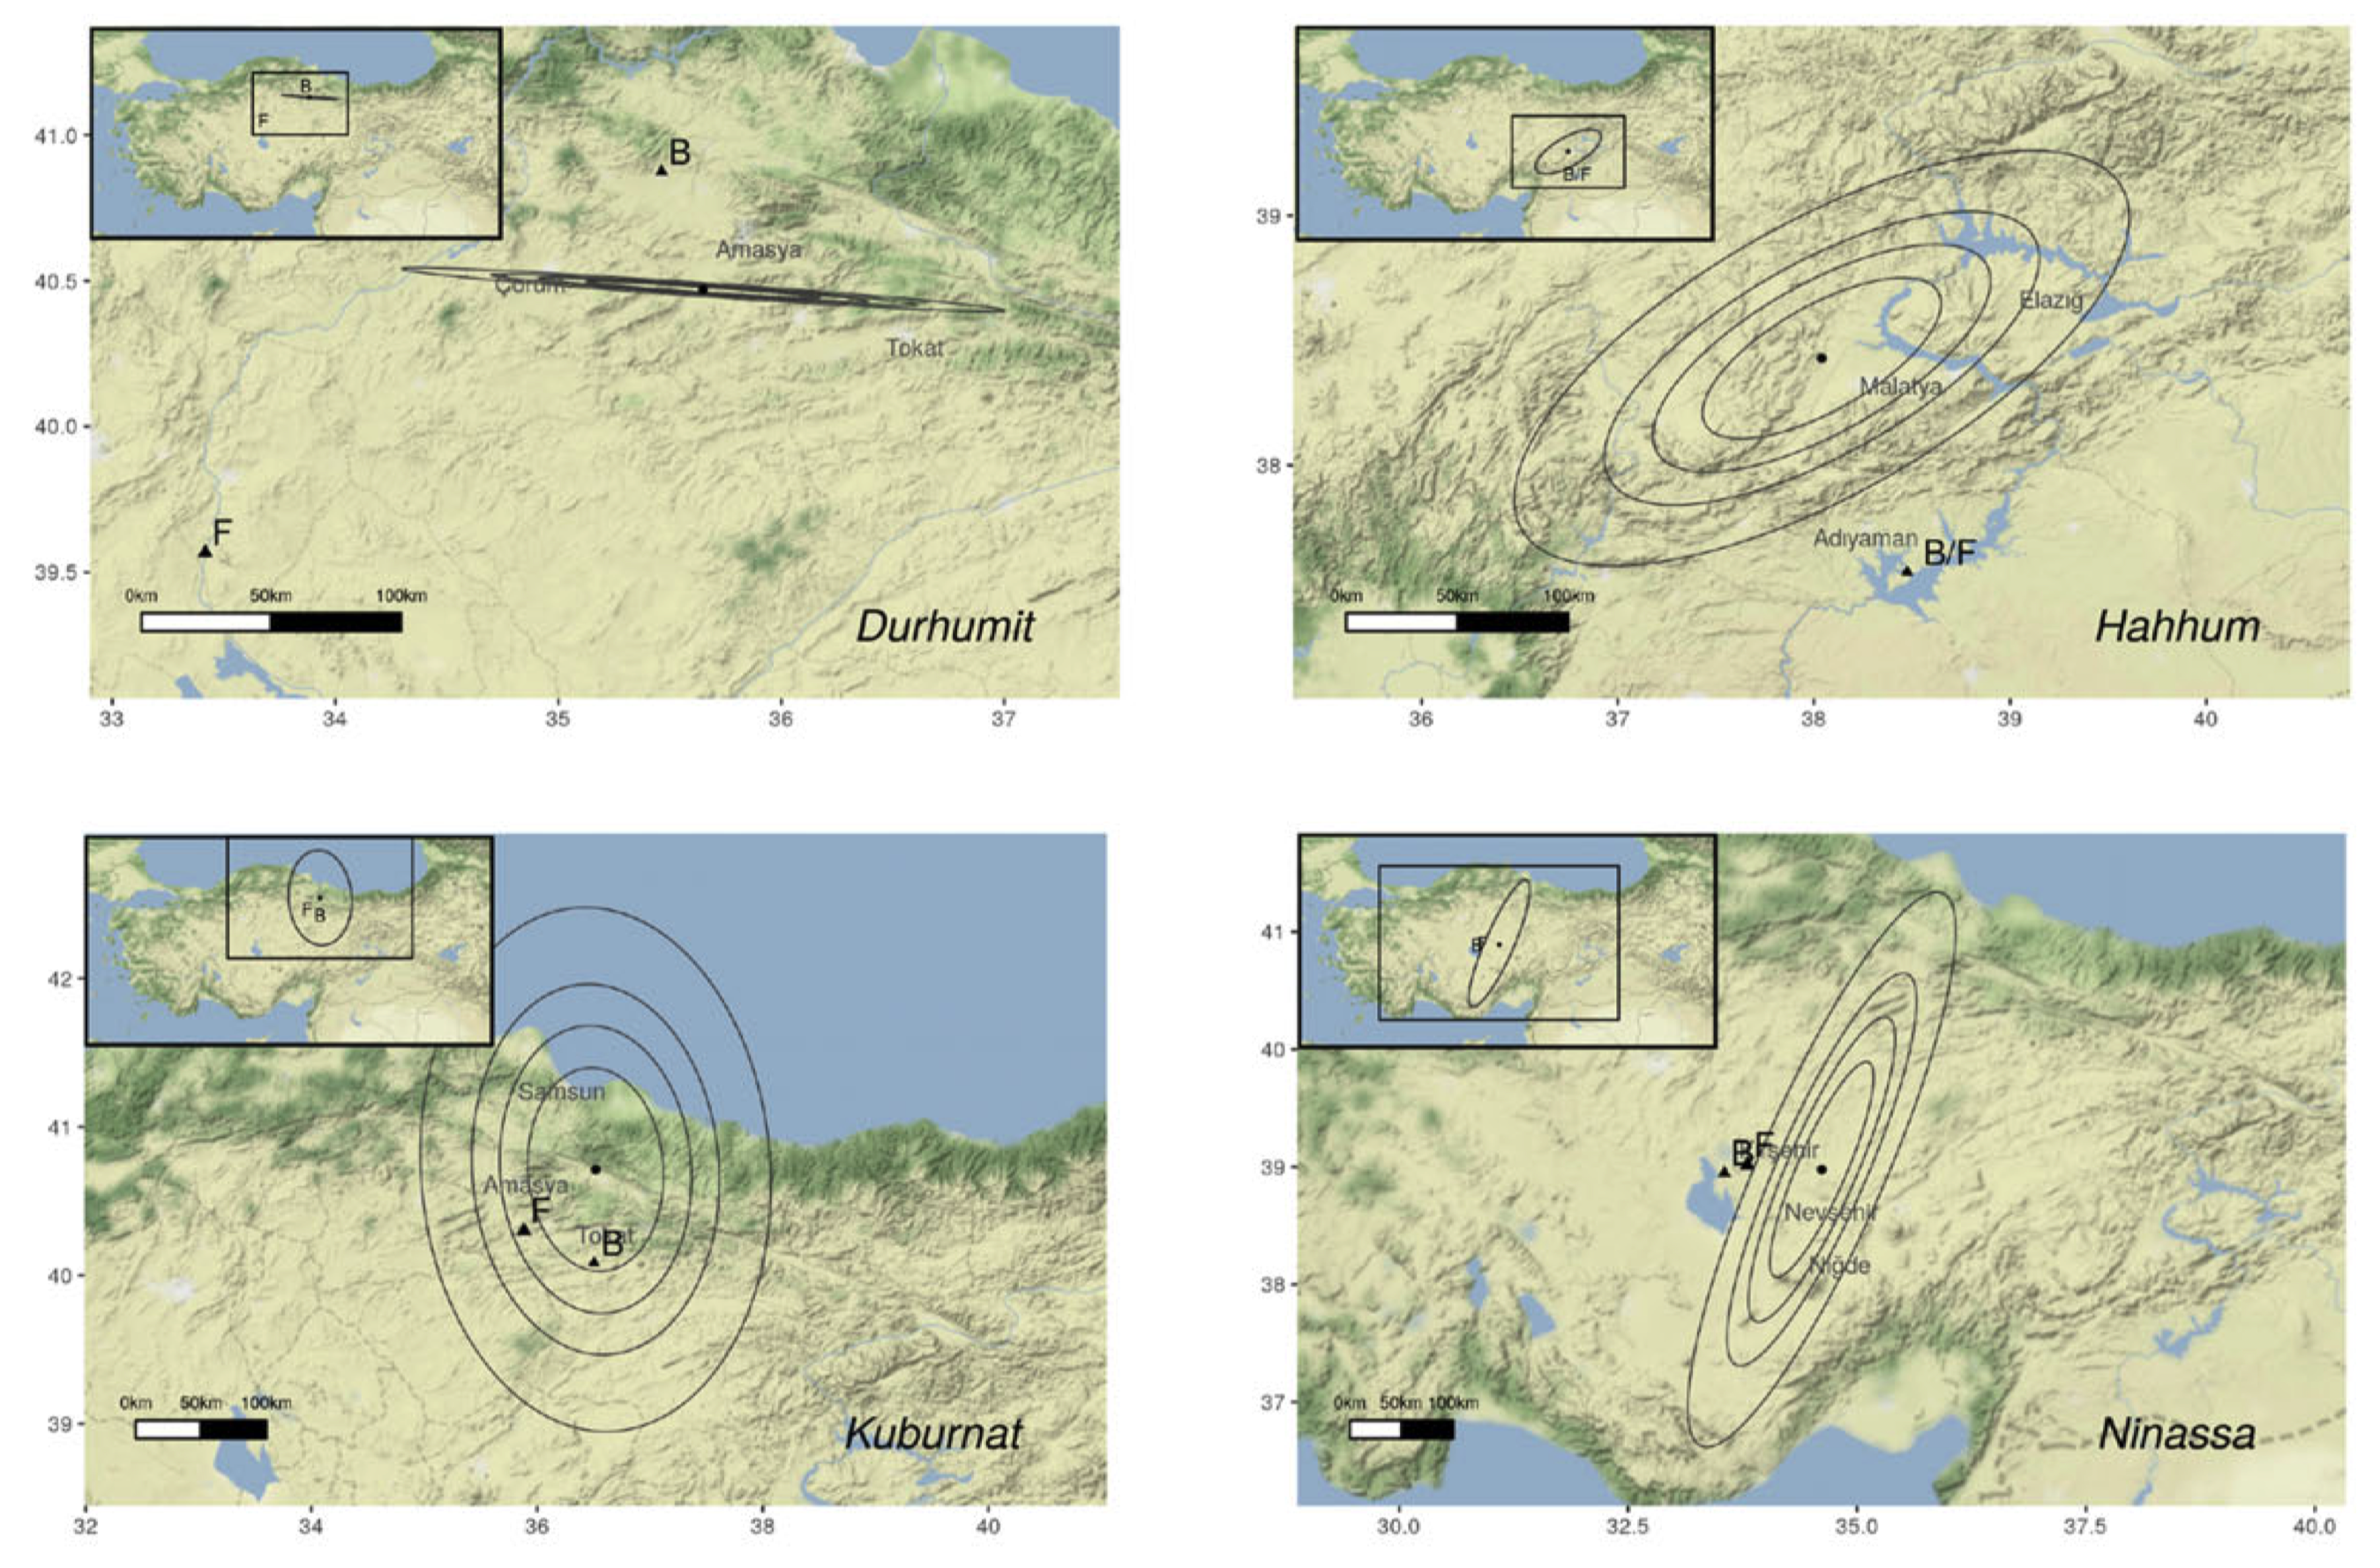
- Novel approach to estimate the locations of lost cities from the Bronze Age
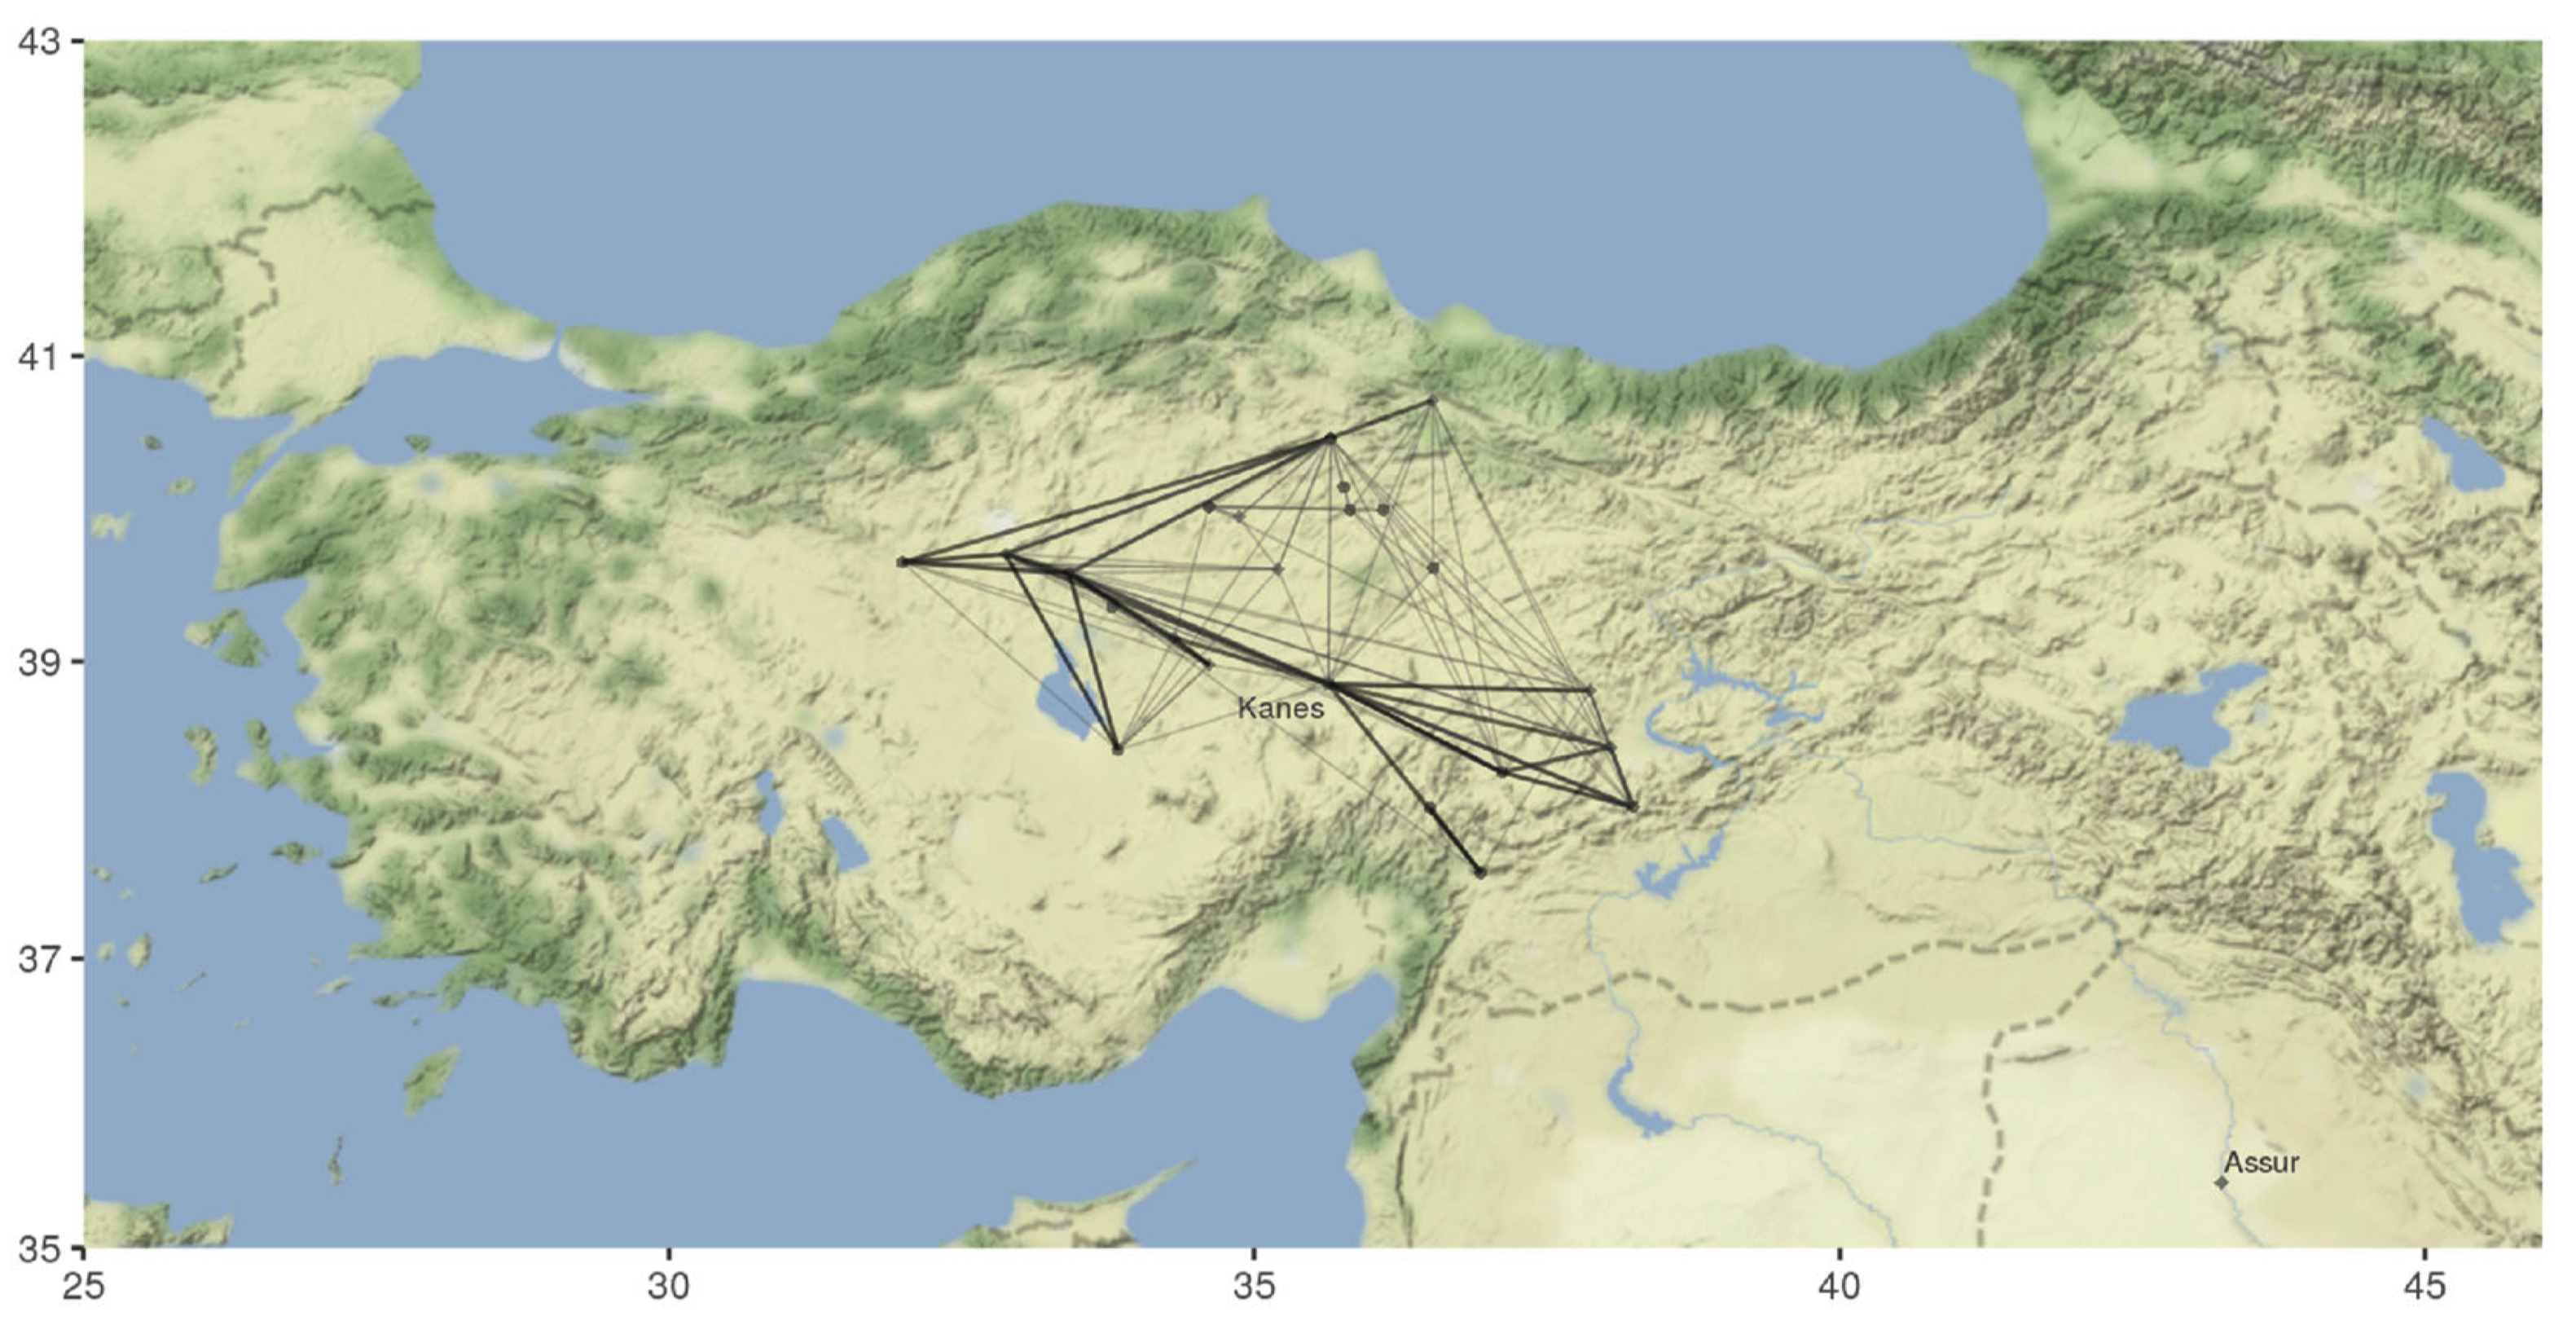
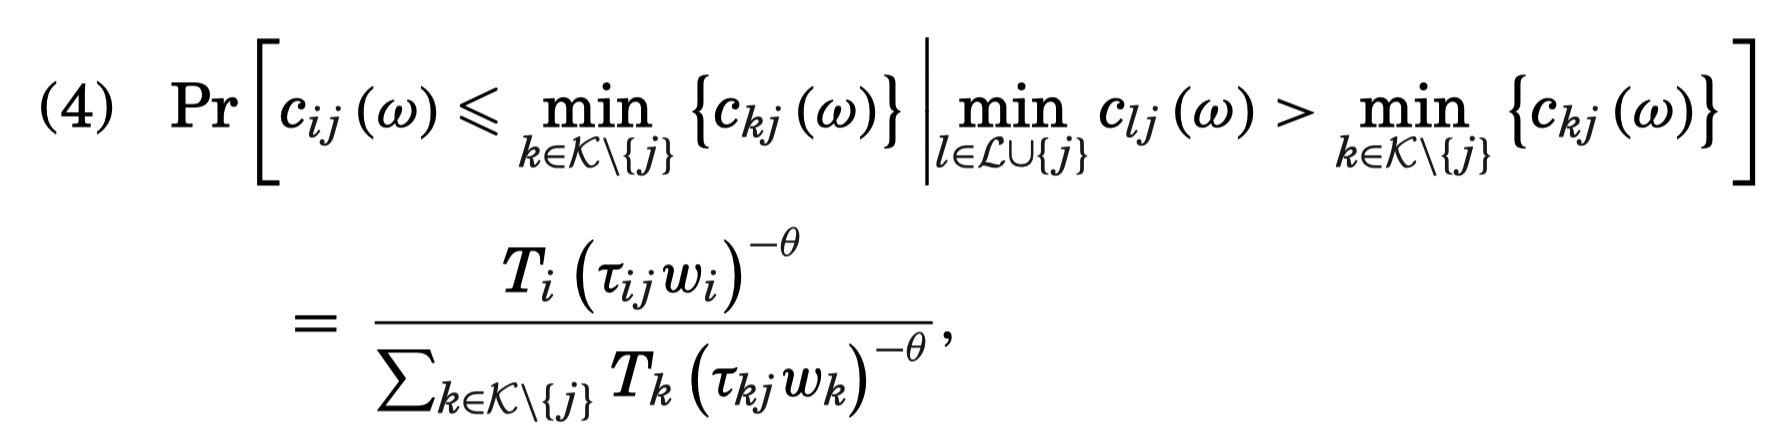
- Structural gravity model to estimate the locations of lost cities based on trade data from ancient texts
- Ancient city sizes are persistent, meaning that large ancient cities tend to be located at or near large modern cities
Data and its novelty
- Sample of 9,728 digitized texts and approximately 2,000 additional non-digitized texts
- Ancient texts to extract information about trade routes and city locations
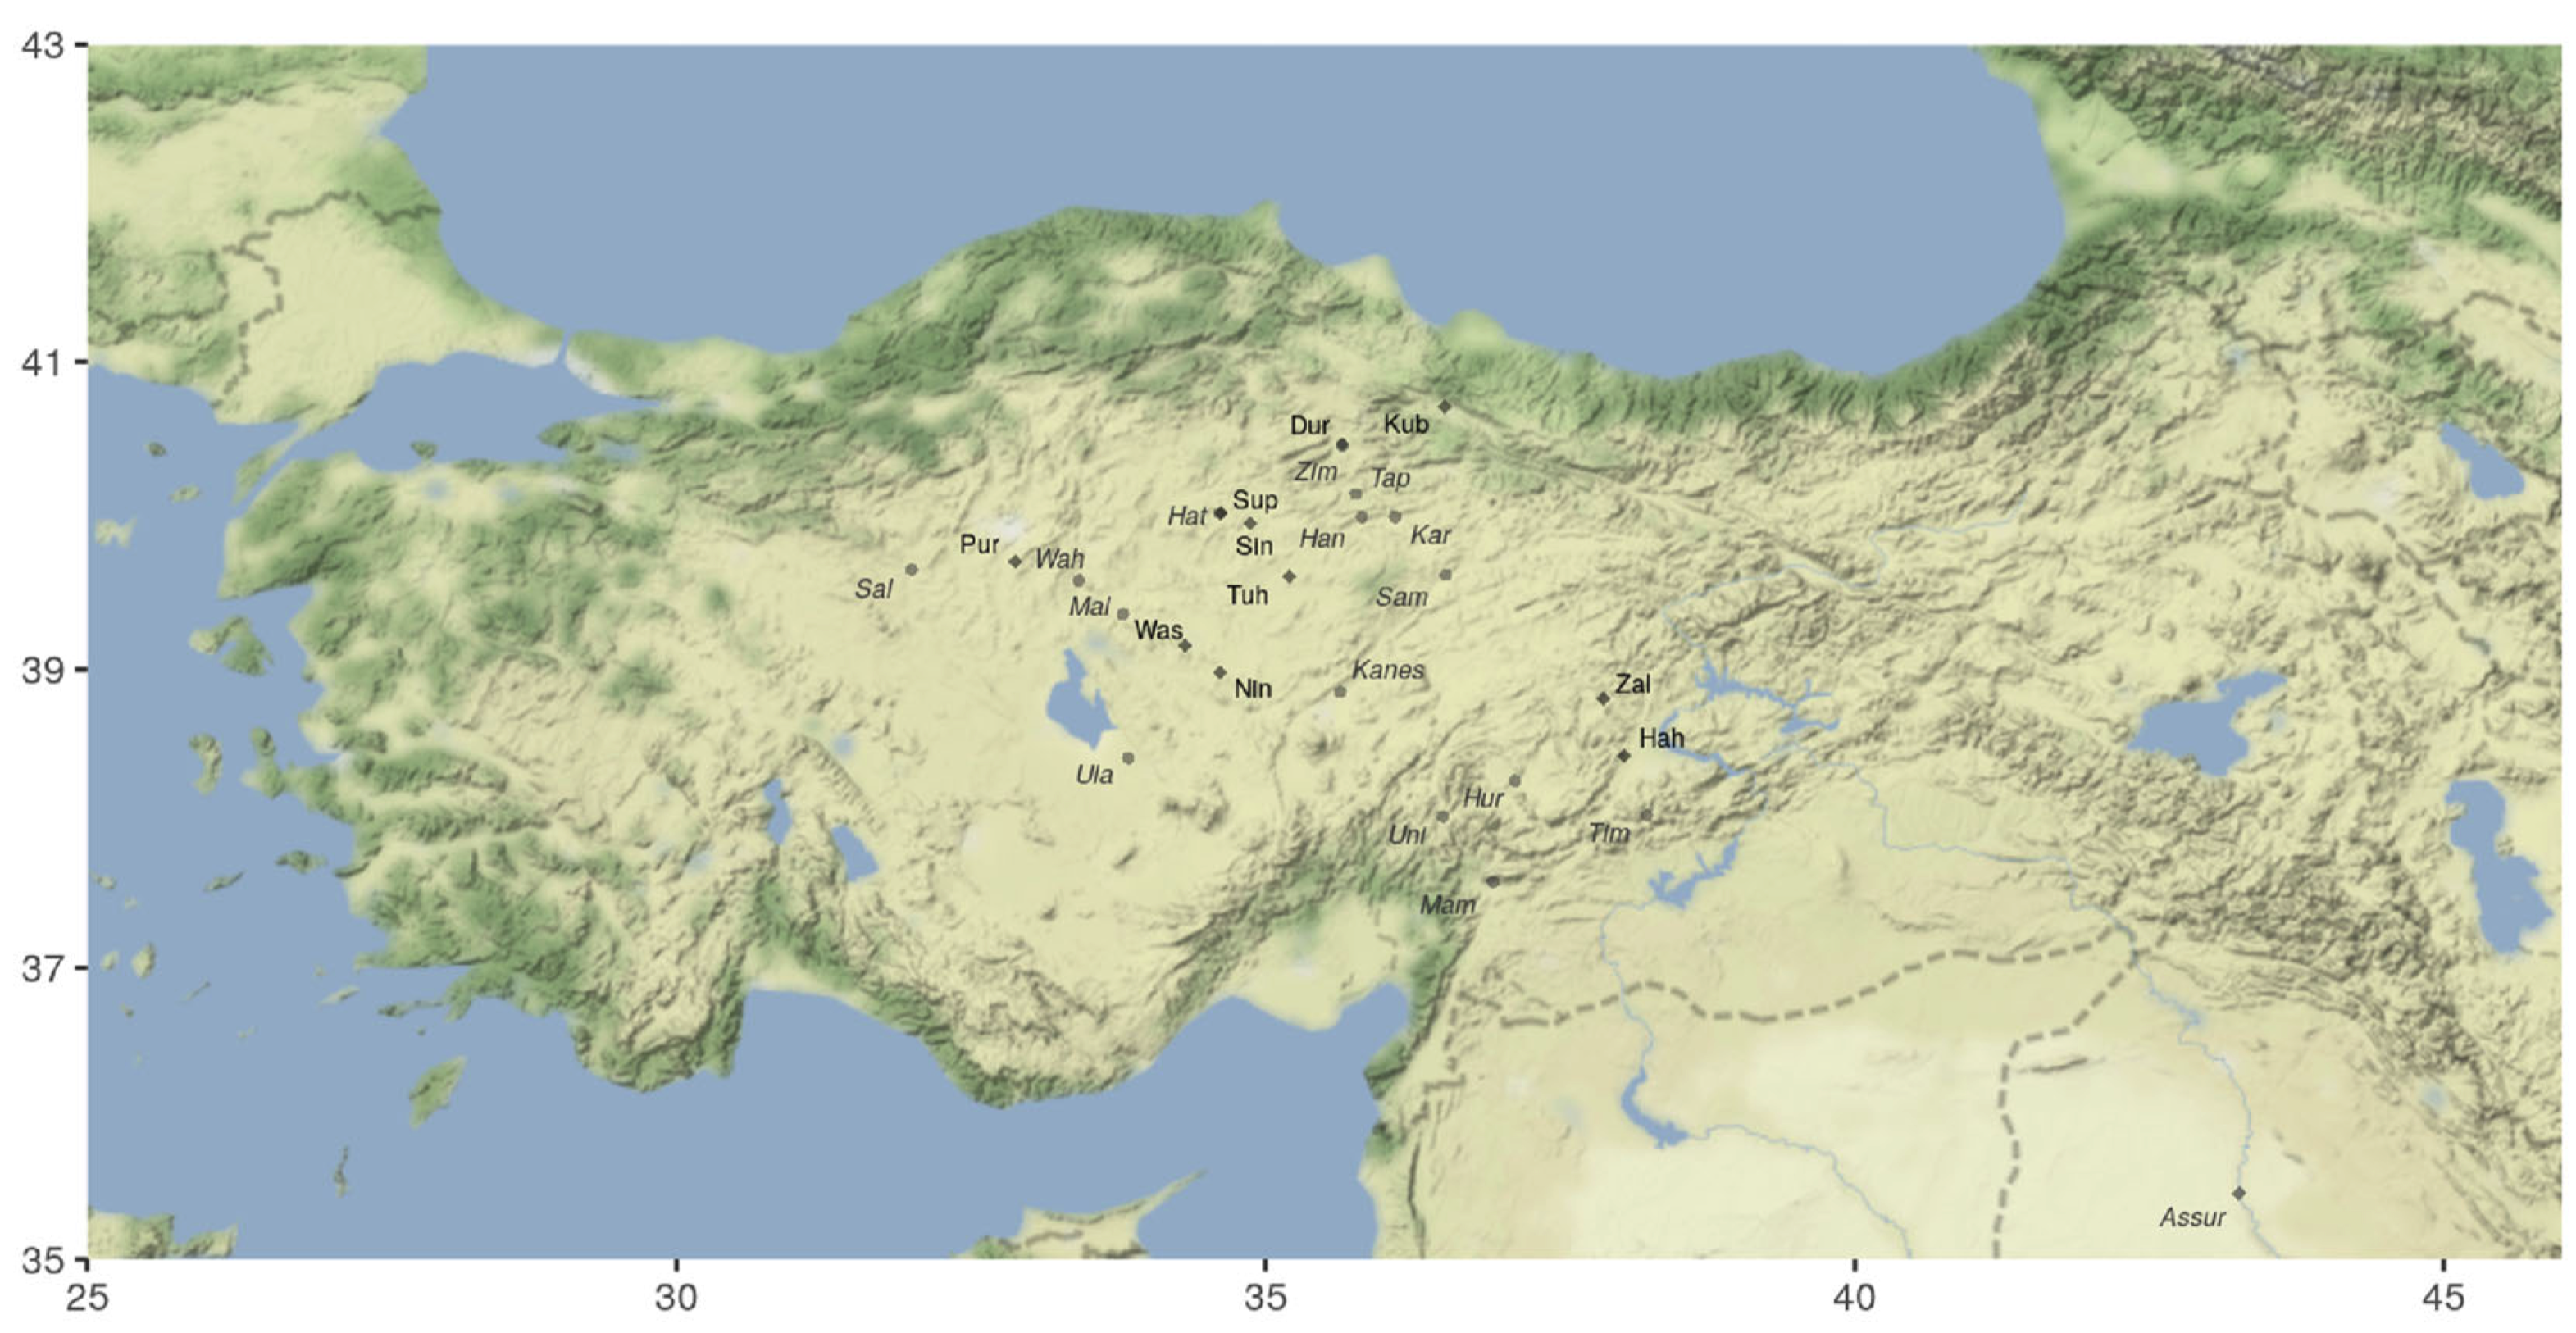
- Data mentions 79 unique settlements, with the analysis restricted to 25 Anatolian cities in Turkey
Empirical strategies
- Structural gravity model to estimate the locations of lost cities
- Detailed data on the topography of the entire region surrounding Anatolia to compute travel times
Discussion
- May be a systematic bias for larger cities to be more or less likely to have been unambiguously located by historians
- Large ancient cities may never be discovered, as they lay buried under modern cities
- Data does not observe internal transactions, a purchase in a city of a good sourced locally in the same city